7/24/12 AM LAB: Invert Dissections
Oyster Dissection:
- Went in through hinge with shucking knife and hammer & then ran along the edge of the shell being careful not to puncture the visceral mass, but cutting the abductor muscle
- After flipping back the mantle, the paired gills were exposed (light tan).
- As filter feeders, oysters trap particles in the gills, then use cilia to move the particles to the grove at the base of the gills and back to the labial palps (2 pairs) which determine which particles should be retained for food and which should be expelled as pseudofeces.
- Dissected out 5mm section of gills, prepared a wet mount and saw the cilia beating at the edge of the gill filaments
- Dissected part of the gonads, which covered most of of the visceral mass. Oocytes
- Dissected out the gills and labial palps
- Removed the pericardial sac to expose the heart, it was still beating. We removed the heart.
- Caroline removed the visceral mass from the shell and collected the oocytes to fertilize.
- We tried to expose the stomach, but the gonads made it difficult to access it.
- We took a cross section of the mass and exposed the brown colored stomach.
Spot Prawn Dissection:
- Reviewed the external anatomy
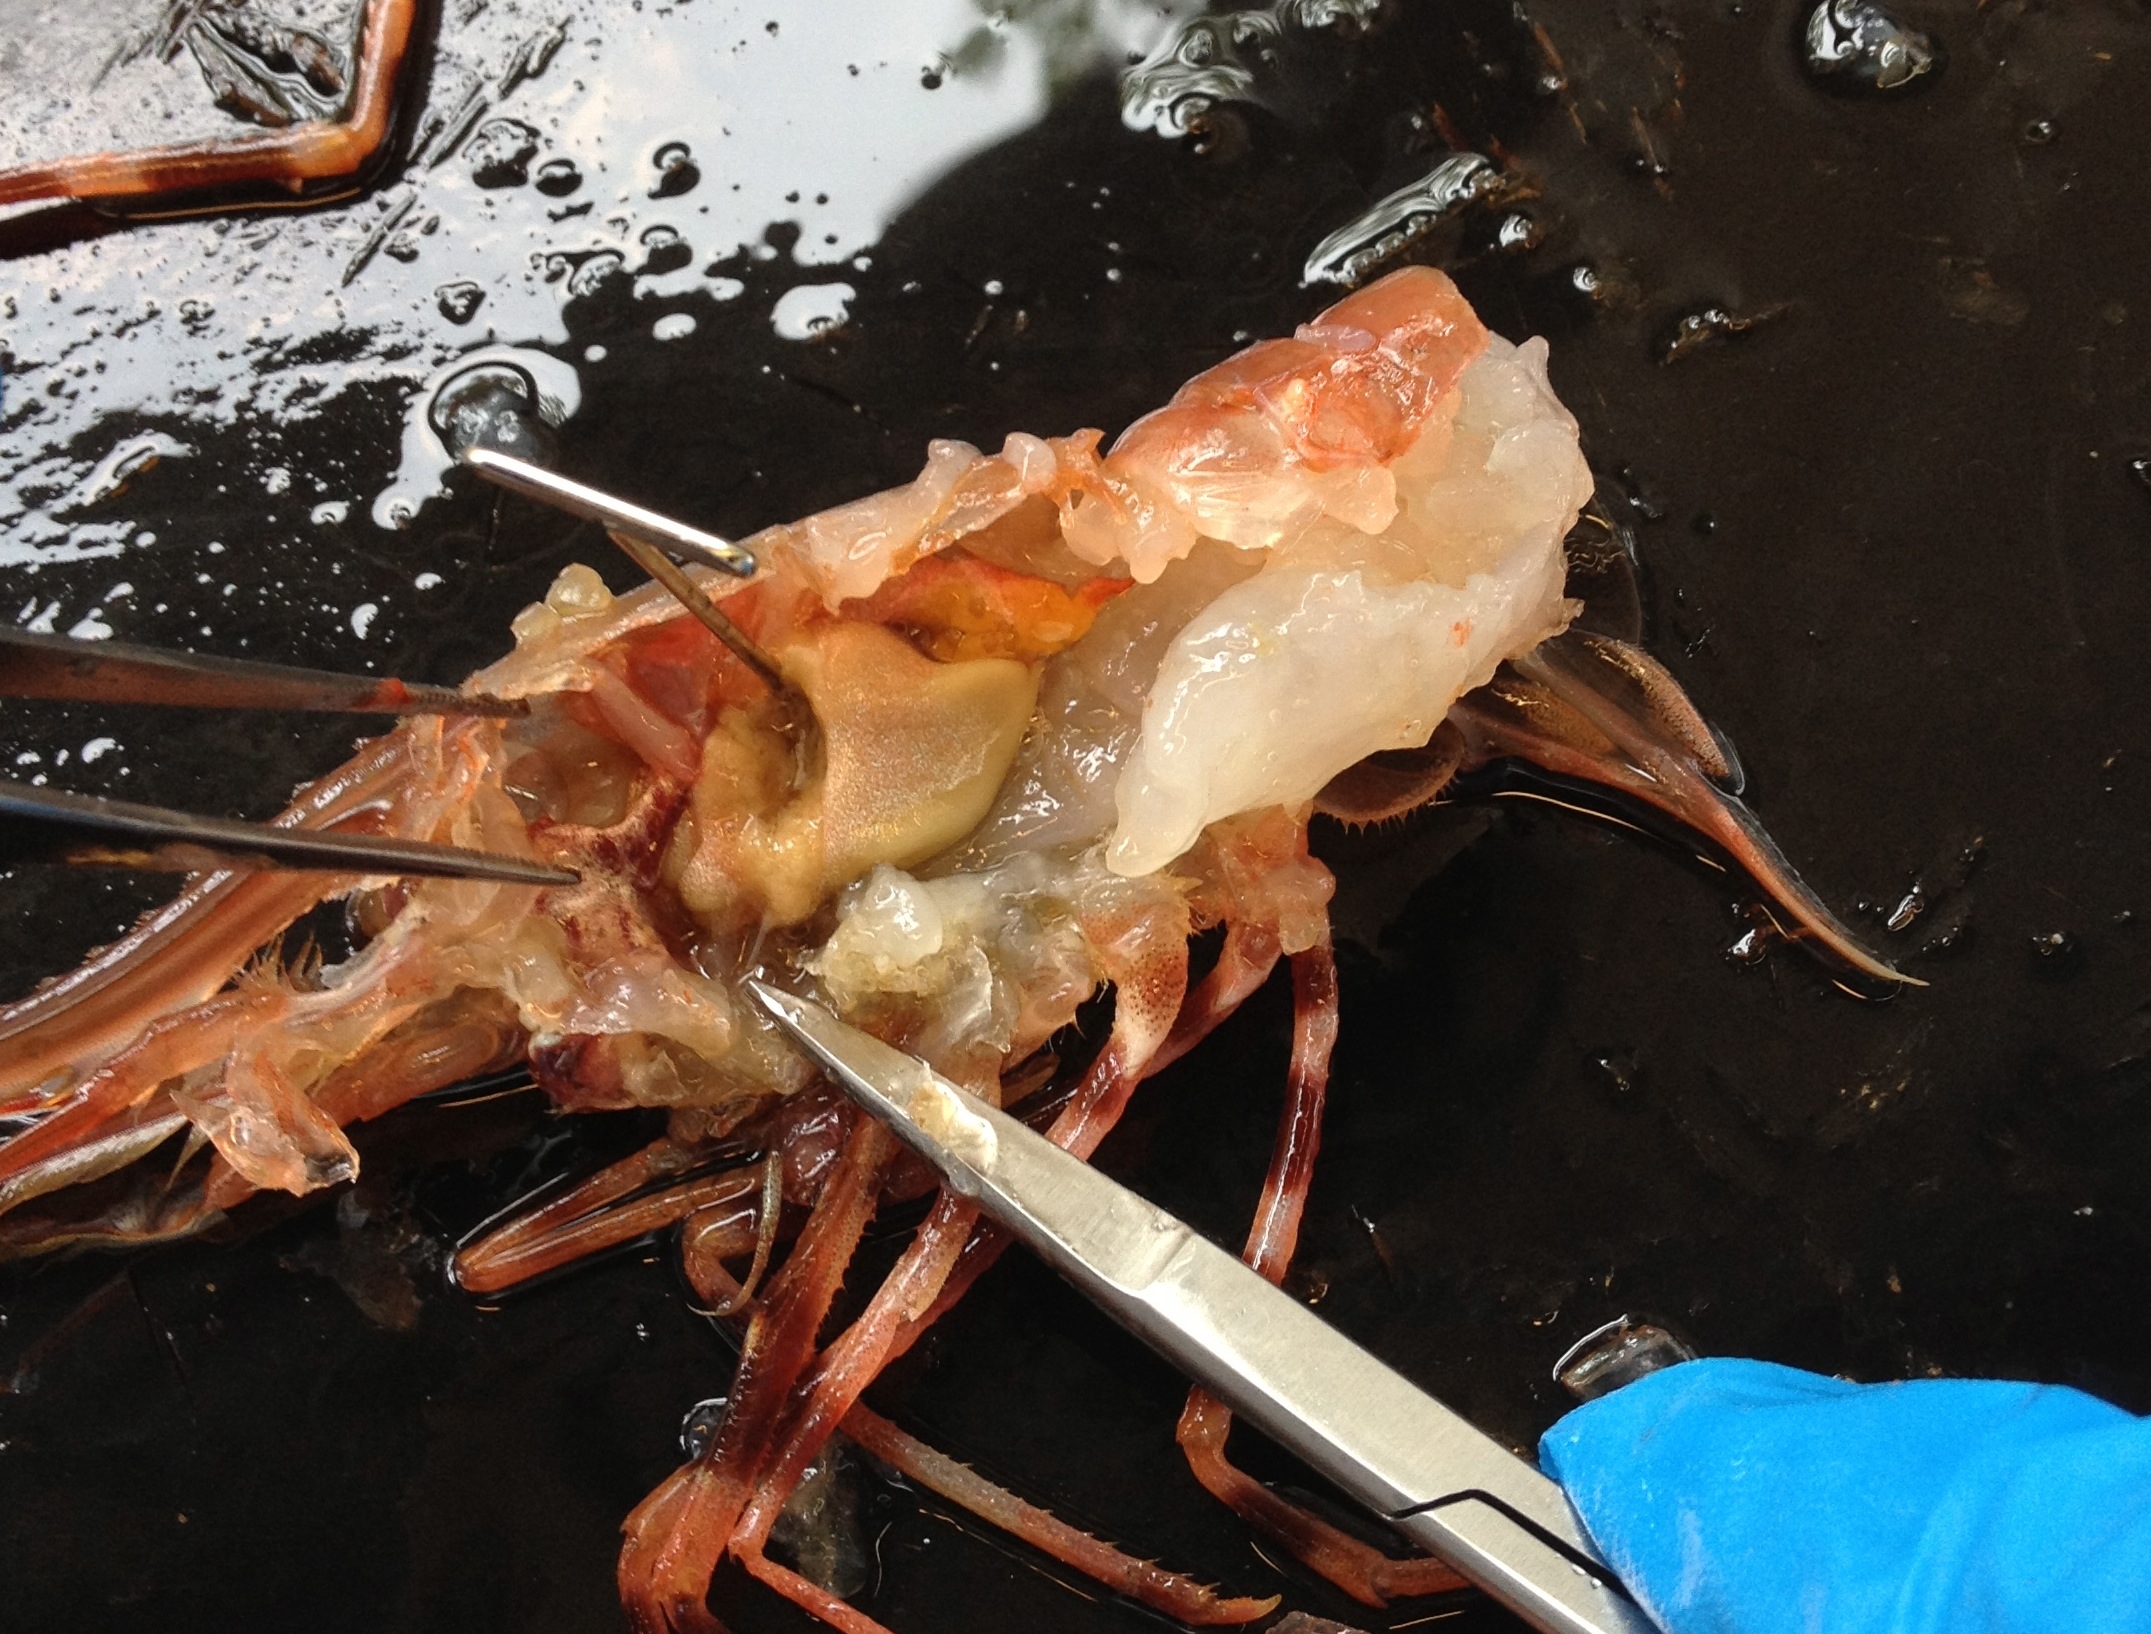
- Removed the carapace to expose the gills
- Removed the eye and looked at the compound eye under the scope
- Cut cross section at the juncture of the carapace and abdomen.
- we cut longitudinally across the abdomen exposing the posterior aorta and intestine (under aorta).
- After removing the gills, we exposed the heart, digestive ceca (tan color), testis (bright orange),hepatopancreas (frilly structure), and stomachs (red and anterior of other organs).
7/24/12 PM Lab: Histopathology of molluscs
Caroline and Lisa provided slides of apparently healthy and diseased tissue samples stained with H&E
Goal: read the slides to become familiar with tissue anatomy and parasites/pathogens
Slide # JD467 Red Abalone 205- Box 2
ID: gonaldal tissue (oocytes) surrounding muscle with vessles- small hemocytes distributed throughout muscle (basophilic)
Digestive gland with cental vessel & ferritin granules (stained brown and involved in releasing antioxidants and other enzymes).
Found hypobrachial gland next to mantle and Gills
No visible signs of parasites or pathological changes
Slide #: Abalone coccidia #7
coccidia found in right kidney in aggregations, didn't stain well- faint eosinic cells
BMRL-NIX Box 7:
intracellular pathogen (nuclear inclusion x- NIX)
found in clams- Lisa thinks this slide was from a razor clam
Found in nonciliated brancial epithelium and causes hypertrophy of cell nuclear and rupture of cytoplasmic membrane
Slide highly infested & associated with high hemocoyte aggregations
SPX Perkinsis quasuadi Box 7 6594 29
heavy infestation of perkinsis in digestive gland & and degeneration of gland cells.
7/25/12 Armine Gross Examination and Sample Prep:
Goal: look for gross signs of disease, dissect out digestive glands and prep samples for histopathology and DNA to look for RLO
Armina californica Pathology: PM lab (Gregor, Annie- labmates)
- Armina were collected form sediments around 40' and kept in flow through tanks in lab 10 for 2 weeks.
- Started manifesting signs of disease around 2 weeks, leading to mortality
- Gross Examination:
| Assession # |
12-1-6 |
| Total Wt |
4.3g |
| Total Length |
41mm |
| Lesions |
4 lesions (3x3,3x3,3x3,19x5mm) |
- Gregor took pictures
- Caroline was concerned that we were collecting gonads not the digestive tissue, so she asked us to cut cross sections of the animal slightly posterior.
- We collected for sections
- We put 3 sections in a cassette with foam and fixed in Davidson's fixative for histo (we fixed for 2 days)
- The remaining posterior sample was put in 1.5 ml eppy with 1ml of molecular grade EtOH for DNA extractions
- We also collected a sample of the orange tissue for a squash prep- gonads not DG
- We looked @ a cross section of A. californica from 2010 stained with H&E: dense aggregations of RLO and other basophilic bacterial aggregates in DG
7/26/12 Armina DNA Extractions
Gregor and I used the samples from yesterday (Accession # 12-1-6)
I also ran a blank (everything but the sample).
Method: DNA Extraction (Qiagen Stool Kit)
- Pre-label all the microcentrifuge tubes you will need for this procedure. You will throw away most tubes used, so you need to only minimally label these tubes. You will need a final 1.5 mL microcentrifuge tube, please label this with the following information: your sample accession #, your initials, and the date. Please put the sample # on both the top and the side of the tube. Remember to always run a BLANK extraction as a negative control.
- Remove tissue from ethanol using good sterile technique and cut off a small piece of tissue approximately the size of ½ of a pencil eraser. Weigh the tissue and record in your notebook. Mince the tissue into small pieces and place them into a 2 mL microcentrifuge tube. Take care not to cross-contaminate samples.
- Add 1.4 mL Buffer ASL to each sample. Do this by adding 700 µl of Buffer ASL, vortexing for a minute and then adding another 700 µl of Buffer ASL. Once all ASL has been added, vortex continuously for 1 min or until the sample is thoroughly homogenized. Please note: It is important to vortex the samples thoroughly as it will insure maximum DNA concentration.
- Heat for 5 min at 70º C.
- Vortex for 15 s and centrifuge sample at full speed for 1 min to pellet tissue particles.
- Pipet 1.2 mL of the supernatant into a new 2 mL microcentrifuge tube and discard the pellet.
- Add 1 InhibitEX tablet to each sample and vortex immediately and continuously for 1 min or until the tablet is completely dissolved. Incubate for 1 min at room temperature to allow inhibitors to absorb the InhibitEx matrix.
- Centrifuge sample at full speed for 3 min to pellet inhibitors bound to InhibitEX.
- Pipet all the supernatant into a new 1.5 mL microcentrifuge tube and discard the pellet. Centrifuge the sample at full speed for 3 min. *in this step, the transfer of small quantities of pelleted material will not affect the procedure*
- Pipet 15 ul Proteinase K into a new 1.5 mL microcentrifuge tube.
- Pipet 200 ul supernatant from step 9 into the 1.5 mL microcentrifuge tube containing Proteinase K.
- Add 200 µl Buffer AL and vortex for 15s. *DO NOT ADD Proteinase K directly to Buffer AL* It is essential that the sample and Buffer AL are thoroughly mixed to form a homogenous solution.
- Incubate at 70 ºC for 10 min.
- 14. Remove your samples from the incubator and briefly centrifuge. Add 200 µl of 95% molecular grade ethanol to the sample and vortex for 15 seconds. Briefly centrifuge the tubes.
- 15. Carefully apply this mixture to a QIAamp spin column. If a white precipitate has formed, make sure to add this to the column. Do not wet the rim of the spin column (this can allow cross-contamination of samples in the centrifuge). Centrifuge at 8000 rpm for 1 minute.
- 16. Place the QIAamp spin column in a clean 2 mL collection tube.
- 17. Carefully open the QIAamp spin column and add 500 µl of buffer AW1 without wetting the rim. Centrifuge at 8000 rpm for 1 minute.
- 18. Discard the 2 mL collection tube containing the buffer and place the spin column into a new collection tube.
- 19. Open the spin column and add 500 µl of buffer AW2 without wetting the rim. Centrifuge at full speed for 3 minutes.
- Place the spin column into your final microcentrifuge tube, add 100 µl of buffer AE to the column and allow to incubate at RT for 5 minutes.
- Centrifuge at 8000 rpm for 1 minute.
- Remove the spin column and throw it away. You now have a tube of DNA
PCR Methods
- Calculate the volumes you need for your PCR reactions (see master mix recipes below). Make at least 10% more than you need so that you do not run out of master mix. All calculations should be recorded in your notebook.
- Wipe down bench with 10% bleach.
- To a 1.5 mL tube add all reagents except the DNA template.
- Vortex briefly (pulse).
- Label the PCR tubes with your sample # and primers. Label two tubes (–) for your negative control and two (+) for your positive control.
- For WS-RLO recipe, add 18 μL of master mix to each of the PCR tubes.
- For generic recipe, add 23 μL of master mix to each of the PCR tubes.
- Add 2 µL of PCR water to each negative control and cap.
- Add 2 μL of template DNA to each tube and cap, taking care not to cross contaminate between samples.
- Add 2 µL of known positive template into the positive control tubes.
- Vortex briefly (pulse) and spin down.
- Run thermal profiles for cPCR.
cPCR generic recipe
We used 3 primer sets:
- universal bacterial - EUB A/B
- Ehrlichia - EHR16s
- WS-RLO specific - RA 3-6/RA 5-1. The RA primers amplify a 160 bp fragment of the 16S WS-RLO genome.
Annie and I made a master mix with Go Taq for both the universal bacterial and Ehrlichia primer sets.
We needed 6 reactions/ primer set, but made enough for an addition 2 reaction to account for pipetting error.
Gregor made the Master Mix for the WS-RLO from scratch.
| Reagents |
uL/reaction |
ul/8 reactions |
| Go Taq |
12.5 |
100 |
| BSA (10mg/ml) |
1.5 |
12 |
| Fwd primer (10um) |
0.8 |
6.4 |
| Rev primer (10uM) |
0.8 |
6.4 |
| sH20 |
7.4 |
59.2 |
| Template |
2 |
16 |
| Total |
25 |
200 |
WS-RLO cPCR recipe
PCR primers from Andree et al. 2000 with optimized protocol of Friedman et al. 2008
| Reagent |
[Stock] |
[End] |
Per reaction (ul) |
Per 8 reactions (ul) |
| 5 X Buffer |
5x |
1X |
4 |
32 |
| MgCl2 |
25 mM |
1.5mM |
1.2 |
9.6 |
| BSA |
10 mg/ml |
400ng/ml |
0.8 |
6.4 |
| H2O |
11.08 |
88.64 |
||
| dNTP's |
10 mM |
200uM |
0.4 |
3.2 |
| RA 3-6 |
100 pmol/ml |
0.5uM |
0.1 |
0.8 |
| RA 5-1 |
100 pmol/ml |
0.5uM |
0.1 |
0.8 |
| Taq |
5 U/ml |
1.6U/ul |
0.32 |
2.56 |
| Template |
2 |
2 |
||
| Total Reaction Volume |
20 ml |
|||
| 1 |
2 |
3 |
4 |
5 |
6 |
| Neg. Control |
Blank Contol |
12-1-6 CSC |
12-1-6 GS |
72910 C-dead AP |
Pos. Control |
We set up new protocols for the thermocycler (A block: GEN, B block: WSRLO)- WSRLO primers have different annealing temps and the assay has been optimized for this primer set.
| Thermal profile |
Temp |
Time |
| Step1 |
95 |
10min |
| 45 cycles of |
||
| Step 2 |
95 |
15 sec |
| Step 3 |
60 |
1min |
Thermal profile
| Time |
Temp (°C) |
|
| Step 1 |
3 min |
95 |
| Step 2 |
1 min |
95 |
| Step 3 |
30 sec |
62 |
| Step 4 |
30 sec |
72 |
| Repeat steps 2-4, 40 times |
||
| Step 5 |
10 min |
72 |
Andree, K.B., C.S. Friedman, J. D. Moore, and R. P. Hedrick. 2000. A polymerase chain reaction assay for the detection of genomic DNA of a Rickettsiales-like prokaryote associated with withering syndrome in California abalone. Journal of Shellfish Research. 19(1): 213-218.
Gel Electrophoresis Methods:
We are going to make 1 gel/ 2 groups
- 1.Weigh 1.5 g agarose and add to 200 ml flask
- 2. Add 100 mL 1 X TBE
- 3. Bring to a gentle boil in the microwave for ~ 3 minutes (1.5min, stop, gently swirl, 1.5min)
- 4. Add 10 µL of SYBR Safe, swirl gently, allow to cool for a few minutes and pour into the gel mold
- 5. Place combs in and allow gel to set for ~ 15min- used small combs & 2 combs/rig, make sure the gel boats have o ring facing long side so that agar doesn't leak out the side of the rig.
- 6. Add 1X TBE to the gel box (~ ½” over the top of the gel)- let set for 10-15 minutes then remove the combs and put gel boat in correct position
- 7. Pipet 7 µl of 100 bp molecular weight ladder in the far end wells
- 8. Add 5 µl of loading dye to your PCR products SINCE WE USED GO TAQ, there is no need to add loading dye. Change tips for every sample to avoid contamination.
- 9. Pipet 7 µl of your PCR product + loading dye into each well.
- 10. Run at 115V for 45 mins or until dye is ¾ way down the gel.
- 11. Carefully remove gel and examine under UV light (wearing nitrile gloves and lab coat).
- 12. Photograph your gel.
Orientation of gel loading:
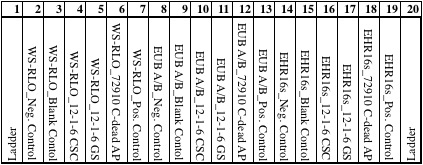
GEL IMAGE TO COME
Results: We only got bands for the universal primers on the positive control and 12-1-6_CSC
PROTOCOL FOR SETTING UP THE HYDROLAB (7/29/12)
We are using the a Hydrolab DS5 to measure a set of in situ water quality parmeters at all of our eel grass monitoring sites. The hydrolab is normally connected to a computer on a boat to measure parameters continuously. However, we would like to launch the hydrolab to record data remotely. Here is the protocol for launching the hydrolab.
- Turn on Acer laptop and plug USB into computer (DON'T GET USB CABLE WET! Keep it is in the red dry bag while in the field).
- Open Hydra software on desktop
- Click "Operate Sonde" & wait for security level to go from 0 to 2 (highlighted with a green box). While you are waiting, switch out the clear storage cup for the weighted sensor guard.
- Important: Make sure you have have tap water available to immerse the probes in after you sample. The probes need to be kept moist, so do not keep them out of water for a long period of time.
- Click "Log Files" tab
- Click "Create" in bottom left
- Give the file a name
- Set logging date, time, launching interval (min= 30sec) and add the parameters you would like to record.
- Save settings & click "Enable"
- Detach cable and shut computer down.
- Put cable back in dry bag.
- When you are finished collecting data:
- Switch the cage for the storage cup (make sure it is filled 3/4 with tap water).
- Turn on computer, attach usb cable and open hydra.
- Select the log file that you created and download the data. The data are stored in the C drive.
7/30/12 False Bay Eelgrass Disease Surveys
Today we started the eelgrass case study to characterize the spatial variation in the putative laby disease in Zostera marina at shallow and deep sites across 3 regions.
The class broke into 3 teams:
Water Quality: Ashton and myself
Shoot Density
Lesion/Disease
- We laid 2 10 m transects out parallel to Sandy's transect, starting at the 35 meter mark.
- The transects were 2 meters apart
- The tide came in too fast, so we were unable to survey the deep sites.
- Density measurements
- Quadrats (1m2) at 0,5, and 10 meters
- Count # of flowering plants
- Total # of shoots
- Lesion measurements (excluding flowering shoots)
- 10m with 6" on either side
- Measure length of longest blade in shoot
- Measure maximum length of each lesion
- Laby collections
- Collected diseased blades and put in whirlpaks with seawater
- Water Quality
- Since the water level was so low, we weren't able to sample directly on the shallow transects.
- We also measured water quality at several sites further off the transect (see map)
- We took GPS points at all water sampling sites & Ashton walked the parameter of the area.
Histology Review and Preparation
- Drew reviewed the histopathology on the samples that she and Catherine collected from Picnic Cove
- 30 diseased blades & prepped D and DH regions from both. 14 Healthy blades
- Blades were sectioned along the short edge of the blade
- Assession #s: PC TR1 D1
- Counting labys in blades
- Count # of zoospores/field in 5 fields @ 40x
- I created a google doc for the data entry
- Note: Everyone was asked to try to quantify a subset of slides for experience, but there is a lot of subjectivity and variability. I suggested that we should have 1 person do all the counts if want to include this in the publication
PM Lab
Laby Isolation from samples collected at FB
- Multiple blades from each transect and surrounding area will be collected, photographed and sampled for laby identification. Paired samples will be taken for histology (to confirm laby infections) and PCR (to determine laby identification) and we will attempt to isolate the laby in culture (total n=30).
- A 2 cm piece of each leaf will be preserved in desiccant and archived to confirm the genetic status of the infected leaf (see Wyllie-Echeverria et al. 2010).
- For laby isolation: Cut lesion or healthy piece ~2cm dipped in 70% EtOH to "sterile" exterior and cut it again in half. Put on a laby agar plate.
- Label: "FB TR1 CSC shallow 7/30 Disease"
7/31/11 Beach Haven Eelgrass Surveys
Hydrolab set up:
Log file name: 073112_beachcomber
Launch:9:52:00
Stop:12:00:00
Interval: 30 sec
Weather conditions: very calm with no wind, low tide
Ashton and I did the water quality
Eelgrass teams:
Anna/Annie-disease
Amy/Sonia-disease
Gregor/Mya-disease
Jamie/Sammi/Jenna-density
Ashton/Courtney-density
We modified the surveys after discussions in class (added in herbivore surveys)
- Notes:
- too many shoots on the deep transect that only surveyed 5m down center of transect
- Surveyed 10m on shallow transect
Density measurements
- Quadrats (1m2) at 0,5, and 10 meters
- Count # of flowering plants
- Total # of shoots
- # of Lacuna and Phyllaplysia egg masses and adults (possibly limpets?) on 5 randomly chosen vegetative shoots
- measure length of longest shoot
Lesion measurements (excluding flowering shoots)
- 5m down center of transect with 0" on either side of the transect
- Measure length of longest blade in shoot
- Measure maximum length of each lesion
- Multiple blades from each transect and surrounding area will be collected, photographed and sampled for laby identification. Paired samples will be taken for histology (to confirm laby infections) and PCR (to determine laby identification) and we will attempt to isolate the laby in culture (total n=30).
- A 2 cm piece of each leaf will be preserved in desiccant and archived to confirm the genetic status of the infected leaf (see Wyllie-Echeverria et al. 2010)
- Since the water level was so low, we weren't able to sample directly on the shallow transects.
- We also measured water quality at several sites further off the transect (see map)
- We took GPS points at all water sampling sites & Ashton walked the parameter of the area.
PM Lab Discussion with Sandy, processing samples, entering data
Feedback from Sandy
- 3 eelgrass species in San Juans and phylogentetics has changed the species dramatically
- enormous genetic diversity at some sites and minimal at others
- Working on diseases susceptibility as a function of genetic identity
- no idea whether disease varies with age structure (we are working on this)
- Type of stress affects the amount of flowing- not all stressors affect physiology the same.
The class broke up into teams (DNA extractions, isolation, and data entry) I worked on data entry
We also started discussing the laby inoculation experiments.
8/1/12 Picnic Cove Surveys
Hydrolab set up:
Log file name: 080112_picnic
Launch:9:45:00
Stop:11:00:00
Interval: 30 sec
15 min boat ride from FHL
Bay was filled with dense eelgrass beds and fine sufide rich sediment. Minimal water cirulation
We arrived at low tide and the tide started rises mid morning.
Sandy set out his 100m transect and set up our deep transects at the 35-45m mark.
Teams:
Ashton and I did the water quality
Eelgrass teams:
Anna/Annie-disease
Amy/Sonia-disease
Gregor/Mya-disease
Jamie/Sammi/Jenna-density
Ashton/Courtney/Sandy-density
We decided to conduct an additional transect (total 3/depth) during these surveys.
Density measurements
- Quadrats (1m2) at 0,5, and 10 meters
- Count # of flowering plants
- Total # of shoots
- # of Lacuna and Phyllaplysia egg masses and adults (possibly limpets?) on 5 randomly chosen vegetative shoots
- measure length of longest shoot
Lesion measurements (excluding flowering shoots)
- 10m down center of transect with 6" on either side of the transect
- Measure length of longest blade in shoot
- Measure maximum length of each lesion
Water Quality
- Since the water level was so low, we weren't able to sample directly on the shallow transects. Shallow completely exposed at low tide
- We also measured water quality at several sites further off the transect (see map)
- We took GPS points at all water sampling sites & Ashton walked the parameter of the area.
8/2/12 False Bay Eelgrass Surveys
Hydrolab set up:
Log file name: 080212_falsebay
Launch:9:30:00
Stop:12:00:00
Interval: 30 sec
Plan: redo quads on shallow 1 and 2 (include herbivores), survey additional transect on shallow (tr3) and conduct deep surveys
Notes: Shallow and deep transects highly variable in sea grass coverage
Transects at 17.3 meter mark along Sandy's transects
Density measurements
- Quadrats (1m2) at 0,5, and 10 meters
- Count # of flowering plants
- Total # of shoots
- # of Lacuna and Phyllaplysia egg masses and adults (possibly limpets?) on 5 randomly chosen vegetative shoots
- measure length of longest shoot
Lesion measurements (excluding flowering shoots)
- 10m down center of transect with 6" on either side of the transect
- Measure length of longest blade in shoot
- Measure maximum length of each lesion
Water Quality
- Since the water level was so low, we weren't able to sample directly on the shallow transects. Shallow completely exposed at low tide
- We also measured water quality at several sites further off the transect (see map)
- We took GPS points at all water sampling sites
- We also surveyed 5 areas within seagrass beds and 5 areas outside of seagrass beds to determine whether temperature varies between these areas.
8/6/12 AM Lab Alkalinity
What is alkalinity: The buffering capacity of the water, the relative amount of proton donor and acceptors
High alkalinity= more buffering capacity, more difficult to shift acidity.
Caroline showed us how to use the DL15. Conducts endpoint titration
We walked through the protocol called "Total Alkalinity Titration on DL15.pdf"
Changes to the protocol:
1. Calibrate the pH probe first
8/7/12 AM Lab Day 1 Prep for Oyster Disease Challenge
List of Vt strains and groups
| Strains |
Groups |
| RE98 |
Gregor, Annie, Courtney |
| RE101 |
Anna, Jenna |
| RE22 |
Amy, Sammi |
| X00123 |
Ashton, Sonia |
| RE66 |
Jamie, Maya |
For this exercise, you will each begin by creating a serial dilution of the stock bacterial culture for the LD50 challenges.
Step 1a: Grow up Vt strains on TIN2 and TCBS Plates
Lisa and Caroline tried to grow up the Vt strains yesterday, but none of them grew up so we are starting over today.Vt strains were isolated from hatchery die offs. We have 5 strains and each group took 1 strain.
We are using 3 different types of agar plates (TSB, TCBS and TIN2)- each group is only using TCBS and TIN2
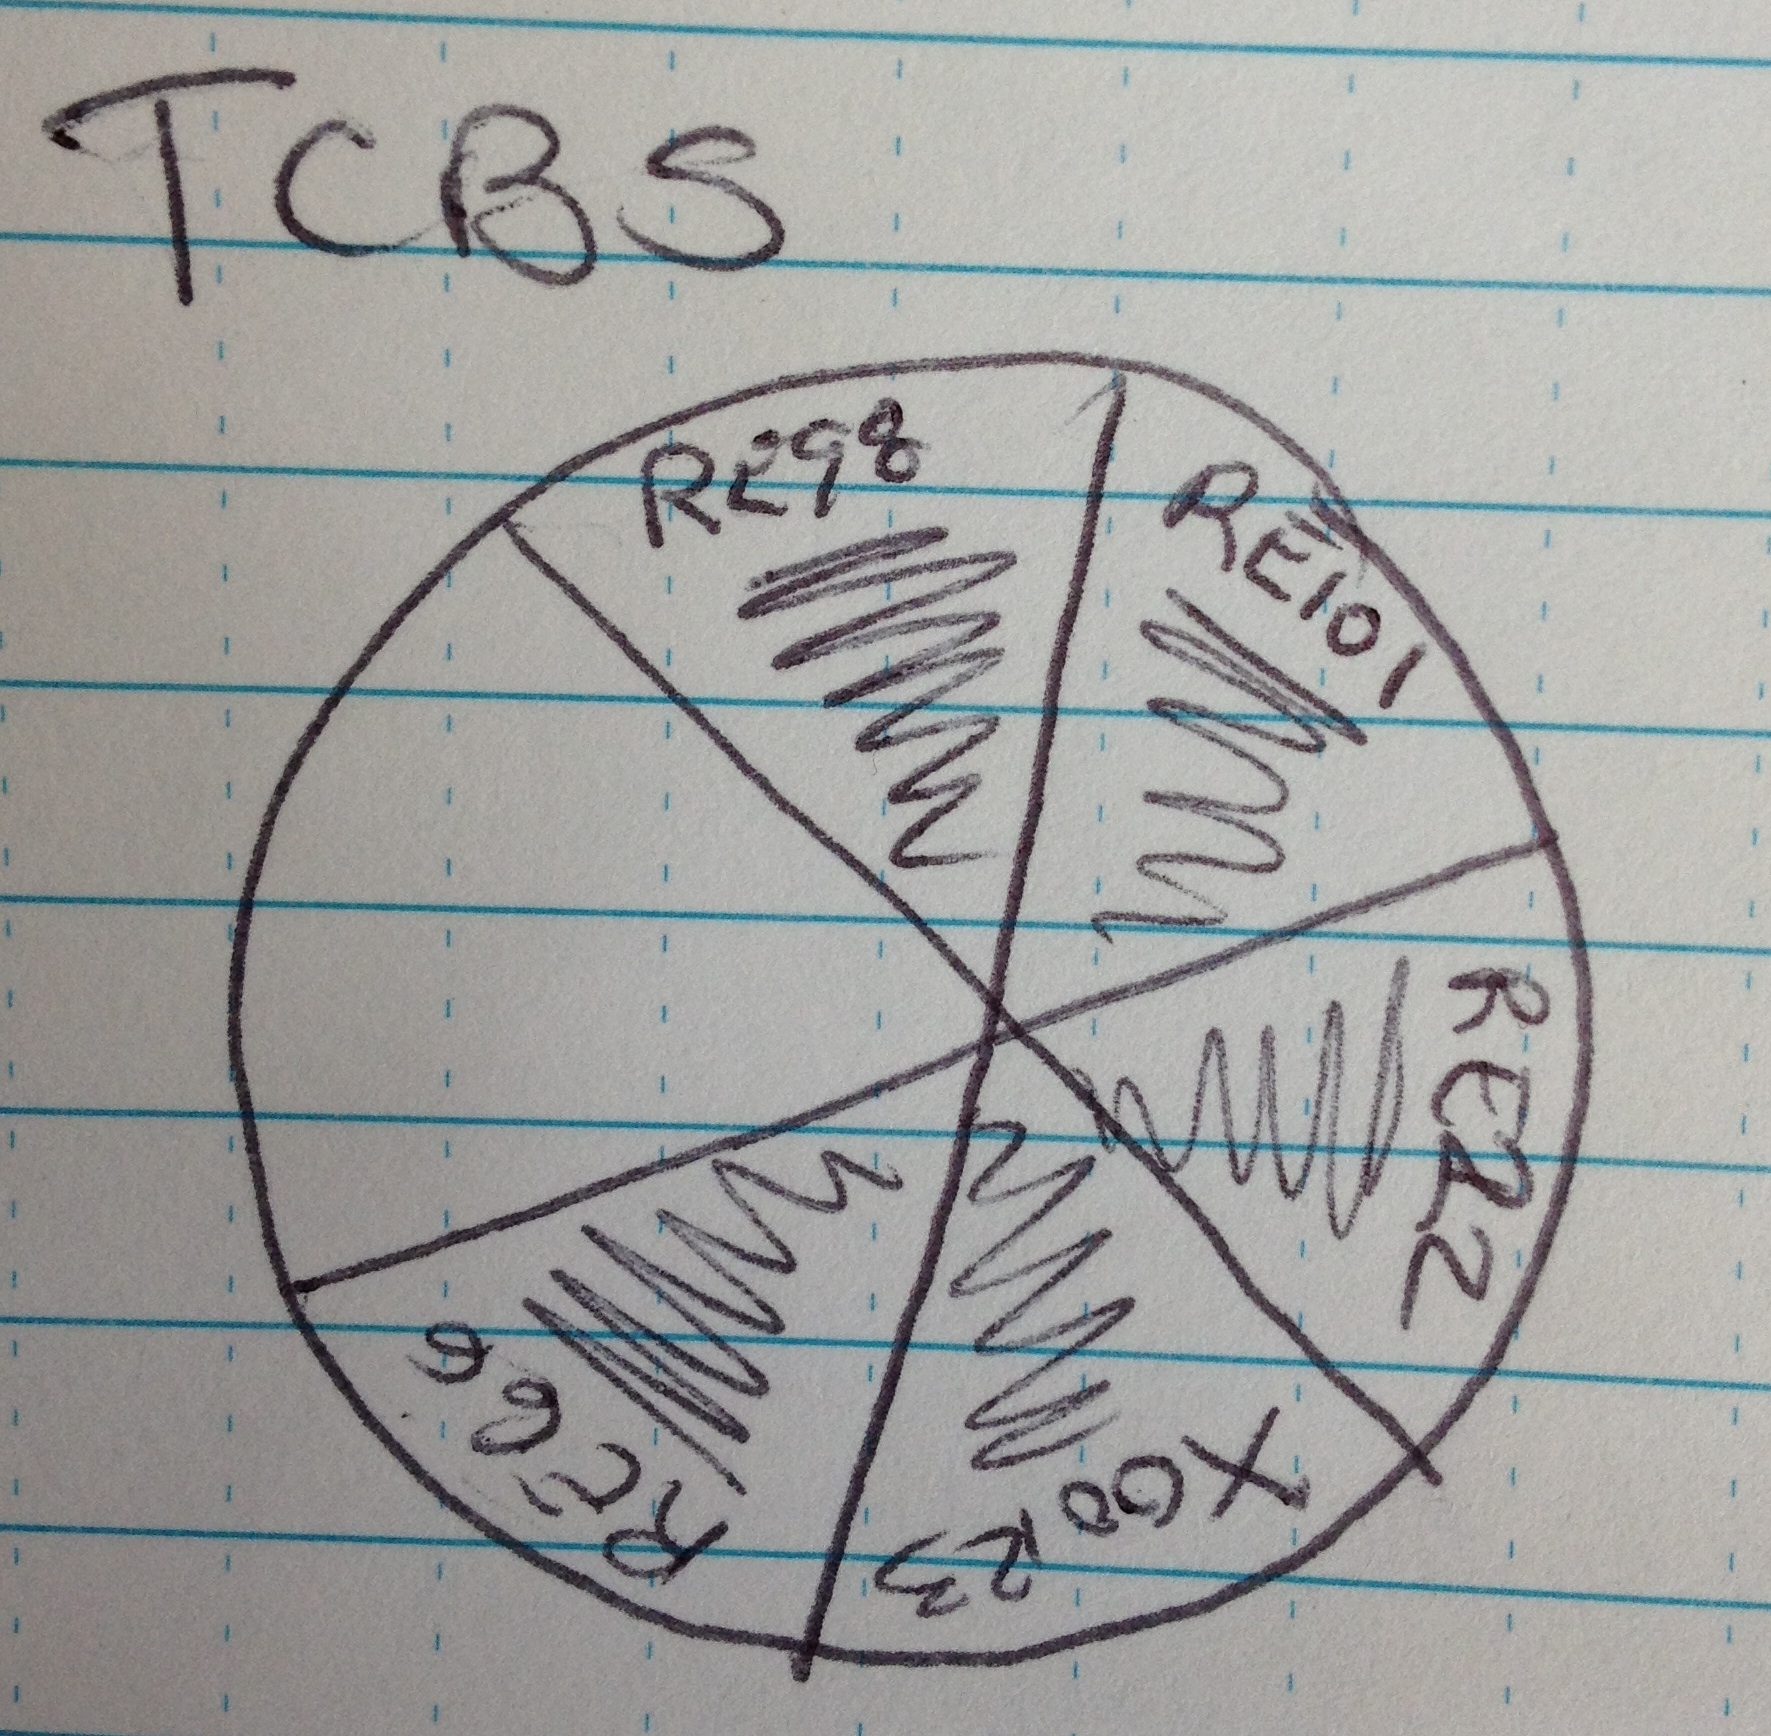
AM= Aeromonus Media
Vt=Vibrio tubiashi
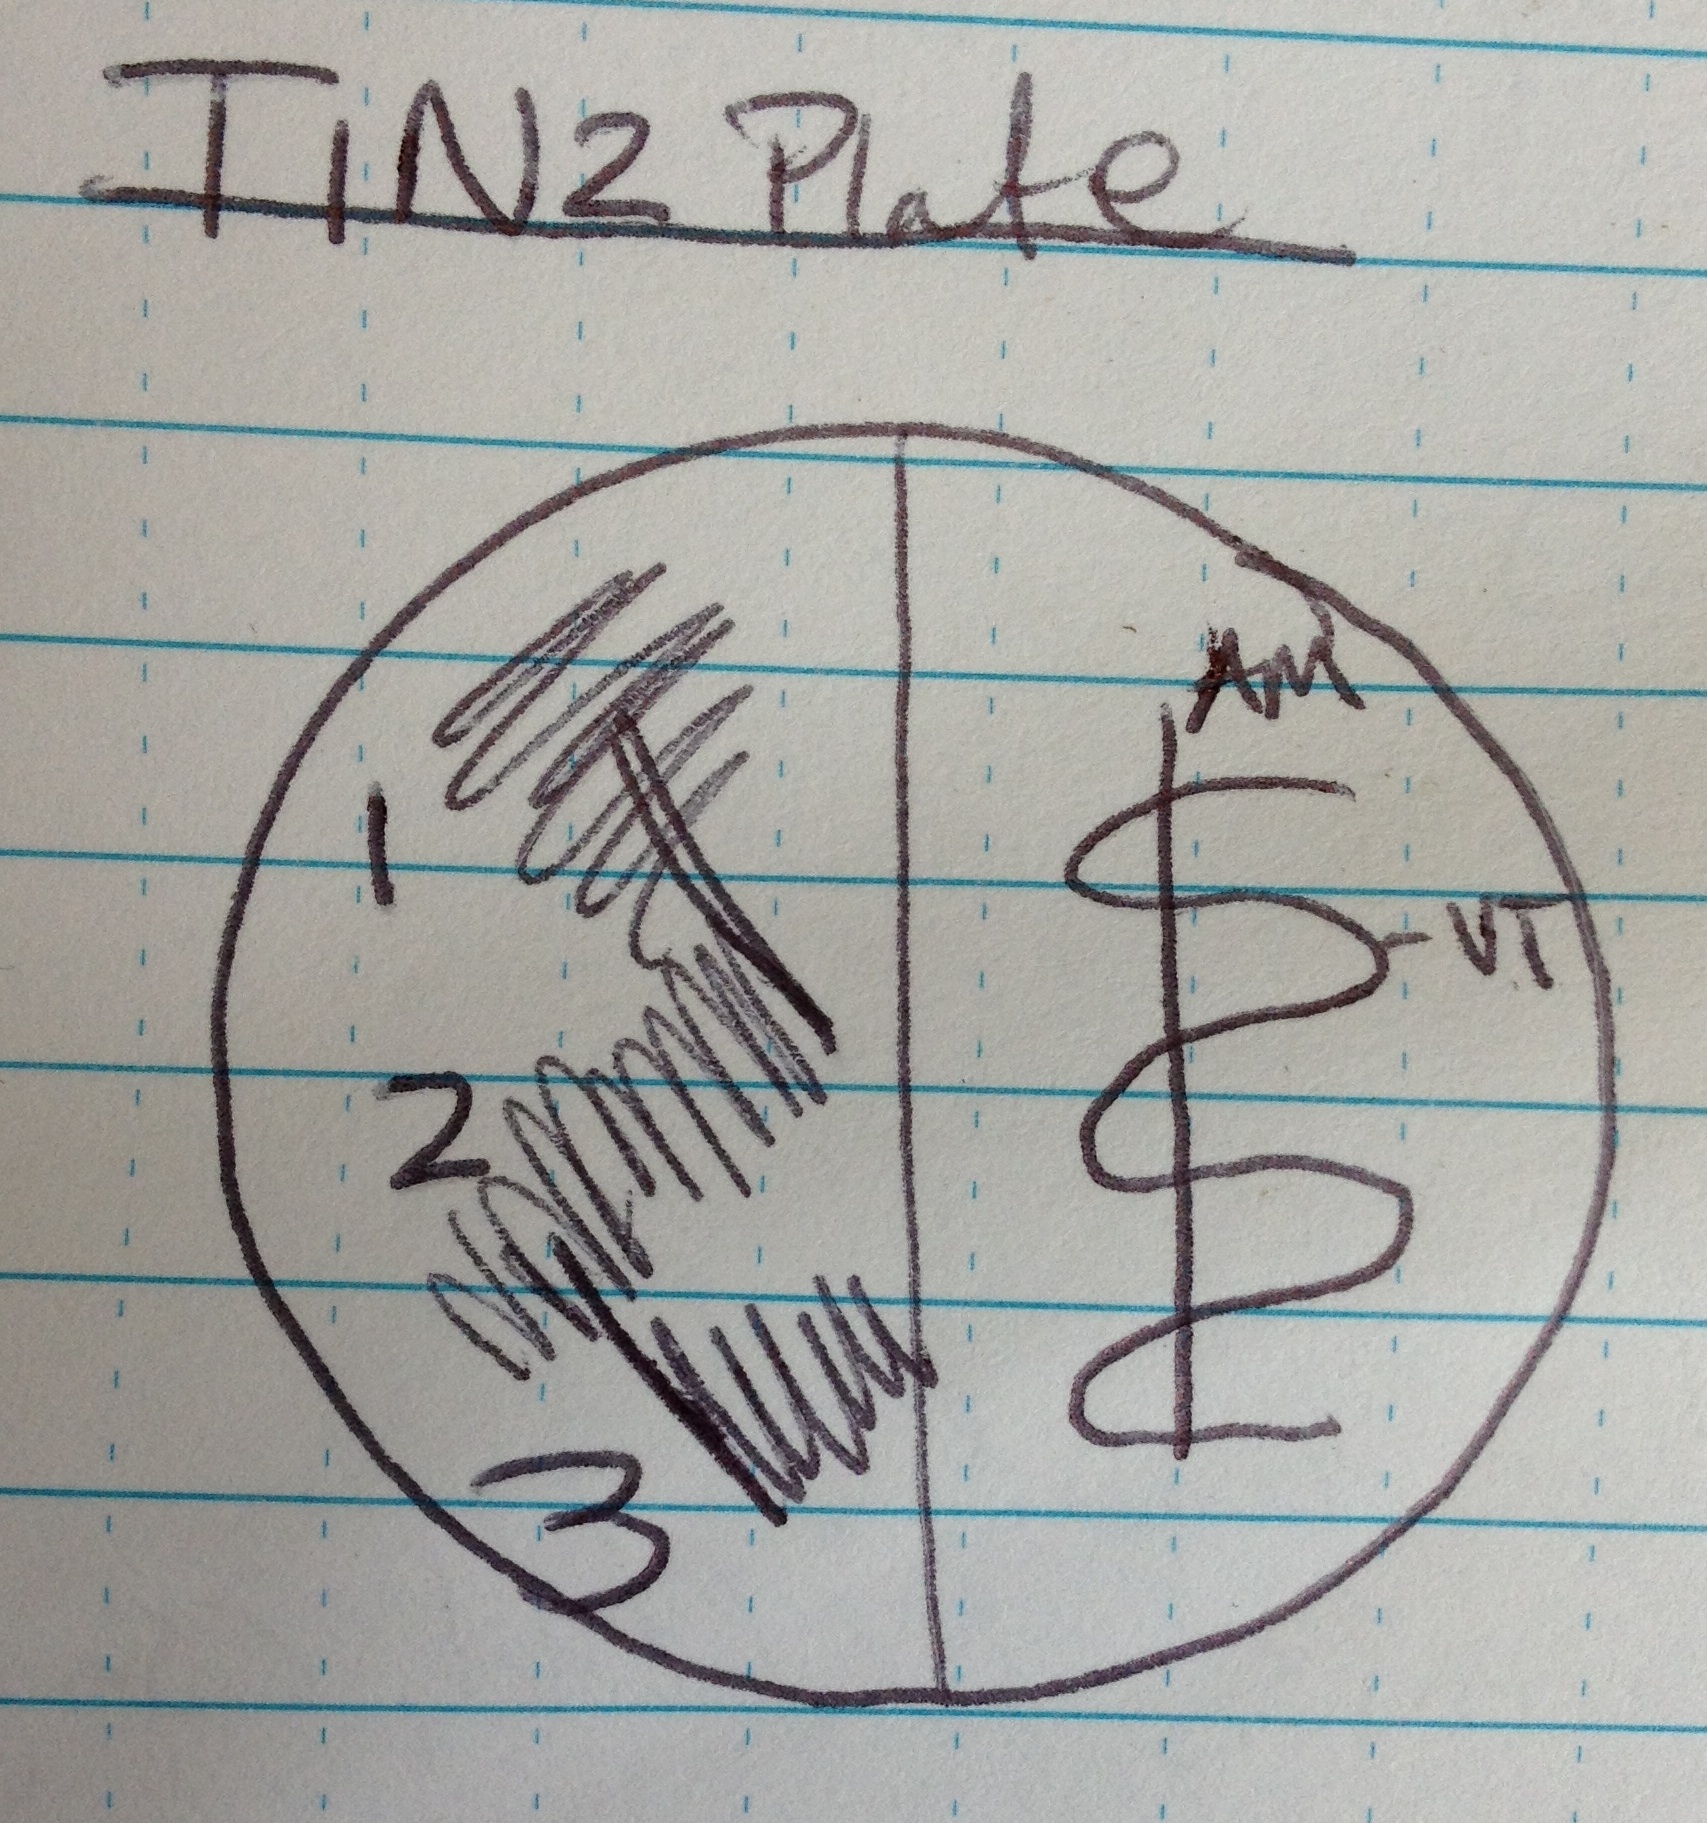
TIN2 Plate:
- Label plate (see above)
- Flame loop
- Take 1 colony from culture plate, streak on AM side in serpentine
- Flame loop
- Dip loop in AM and then streak down the center of the serpentine. If all goes well, the Aeromonus will prevent the Vt from growing down that streak.
- Flame loop
- Take a colony from culture plate, streak in quad 1 on left side of plate.
- Flame loop
- Pull twice from quad 1 and streak quad 2
- Flame loop
- Pull twice from quad 3 and streak quad 3
- Flame loop
TCBS:
- Divide the plate into 6 pies.
- Flame loop
- Take one colony from each strain and streak in respective pie. Flame between strain
Incubate all plates at RT overnight.
Laby Isolation and Prep for Inoculation Experiments
Yesterday:
Lisa autoclaved ~40 eelgrass blades (~5cm long) with 1" of water @135 C for 10 min to sterilize the blades.
These blades are going to be used to grow up on the agar plates with the laby then inoculate the healthy blades.
We are using 4 strains:
1. 8/3/12/ Replicate of Beach Haven CK 1 feathery (this was passed 3 times onto new agar plates)
2. SS 8/4 Replicate of FB 7/30 Sh T-1-D DH (passed once)
3. Sandy strain
4. Sandy strain
Lisa has also been trying to get all 4 stains into broth culture using Colleen's methods, but no luck yet.
Plate set up:
Set up: Sonia and I set up the plates this morning
- Sterilized all utensils between each blade and plate
- Cut out small (~1cm) of agar with laby and transfered to new plate, placing laby side down on plate
- Put 4 pieces of eelgrass on plate (flame between blades)
- We also have 2 control plates (blades with no laby) to make sure that nothing is growing on the autoclaved blades.
- Incubate at RT.
DAY 0:
8/8/11
Day 1: Oyster Disease Challenge
For this exercise, you will each begin by creating a serial dilution of the stock bacterial culture for the LD50 challenges.
Step 1: Serial dilutions and spread plates
For disease challenge:Stock culture containing bacterial isolate
2 - 12-well tissue culture plates with C. gigas larvae
14 culture tubes with SW for dilutions
1000 ul pipets and pipet tips
100 ul pipets and pipet tips
6 T1N2 plates
2 TCBS plates
Hockey stick
Ethanol and sand bath
Bunsen burner
Parafilm
Bacterial loop
32 x 250 ml beakers
For total alkalinity and spectrophotometric pH:
Parafilm
HCl for alkalinity
m-cresol purple for spec pH
CRMs for TA
pH standards for NBS and spec pH
TA machine
Ocean optics machine
Cuvettes
50ml serological pipettes and pipettor
Ziploc bags
25°C Water bath
Lens paper
Kimwipes
- Obtain the Vt (RE22) and Am (Ambient) isolates for the challenge you will be conducting. Annie made the serial dilution of the Vt strain & Gregor did the Am
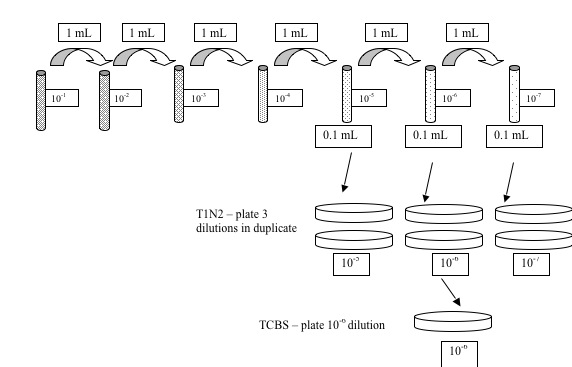
- Make a serial dilution of the Vt to 10-7
- Start by adding 9 mL of seawater to 7 culture tubes.
- Label each of the cultures tube with one of the following dilution labels (10-1, 10-2, 10-3, 10-4, 10-5, 10-6, 10-7).
- Start dilution series by taking 1 mL of bacterial suspension and adding it to the tube labeled 10-1. This is your first 10-fold dilution. Mix well making sure to hold cap with thumb securely.
- Next take 1 mL of your 10-1 dilution tube and add to the tube labeled 10-2. This is your second dilution. Mix well.
- Repeat the above process until you finish the dilutions out to 10-7.
- Make a serial dilution of Am to 10-6 using the methods in Step 2. OUR STRAIN: Vt RE 22
- Obtain 6 T1N2 plates. Label each of the plates with a dilution (10-5 through 10-7) and Vt strain. Obtain 3 TSB plates. Label each of the plates with a dilution (10-4 through 10-6) and Am strain
Be sure to include dilution, the date, and your initials on the BOTTOM of each petri plate. Obtain 1 TCBS plate, draw a line down the center of the plate.
- Plate 0.1 mL of bacterial suspension onto the appropriate T1N2 or TSB plate. If you start from the lowest dilution (10-7) to the highest dilution (10-5), then you can use the same pipet tip.
- Plate 0.1 mL culture onto a TCBS plate. Use one plate for each culture.Plate out Am on 1 side and Vt on the other side. We used a flame loop and concentrated strain TCBS (thiosulfate citrate bile salt sucrose) agar is a selective media for different types of bacteria of the genus Vibrio. Different species of Vibrio produce different colored colonies on the TCBS agar. Do you recall what the color change is indicative of from lecture?
TCBS agar is a type of selective agar to isolate Vibrio spp.Inhibition of gram-positive bacteria is achieved by the incorporation of ox gall, which is a naturally occurring substance containing a mixture of bile salts, and sodium cholate, a pure bile salt. Sodium thiosulfate serves as a sulfur source and, in combination with ferric citrate, detects hydrogen sulfide production. Sucrose is included is metabolized by some of the vibrios.
- Dip hockey stick into ethanol sand bath and flame the hockey stick. Cool the hockey stick by touching it to a sterile, dry area of the plate and then spread the bacterial suspension in a circular motion. Again, start with the lowest dilution to highest dilution for all.
- Leave plates on the bench right-side up for about an hour. Seal plates in parafilm, invert, and incubate at 30C overnight.
Step 2: Oyster challenge
Serial dilutions of bacteria from Step 1Larval oysters
LD50 challenge with V. tubiashii
- Seawater chemistry will be assessed prior to and after the experiment (spec pH and TA- see spectrophotmetirc pH and Total alkalinity protocols). For this we will prepare triplicate 250 ml beakers containing 200mls of
- seawater at right CO2 level
- seawater at right CO2 level with 105 of Vt/ml and 2,000 C gigas larvae
- seawater at right CO2 level with 105 of Am/ml and 2,000 C gigas larvae
- Seawater samples: (Caroline did this).
- Screen seawater and larvae into a clean beaker to remove larvae.
- Take pH of all three types seawater samples (a-c above) with the TA machine’s pH probe.
- Then Over fill spec pH cuvette with sample type (a)=seawater only, cap and process as per spec pH protocol.
- Use remaining seawater to measure alkalinity as per alkalinity protocol.
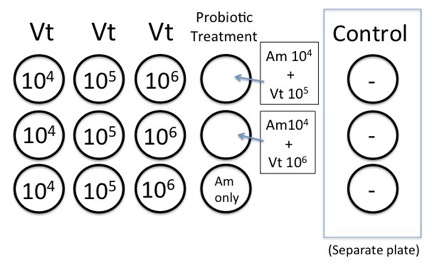
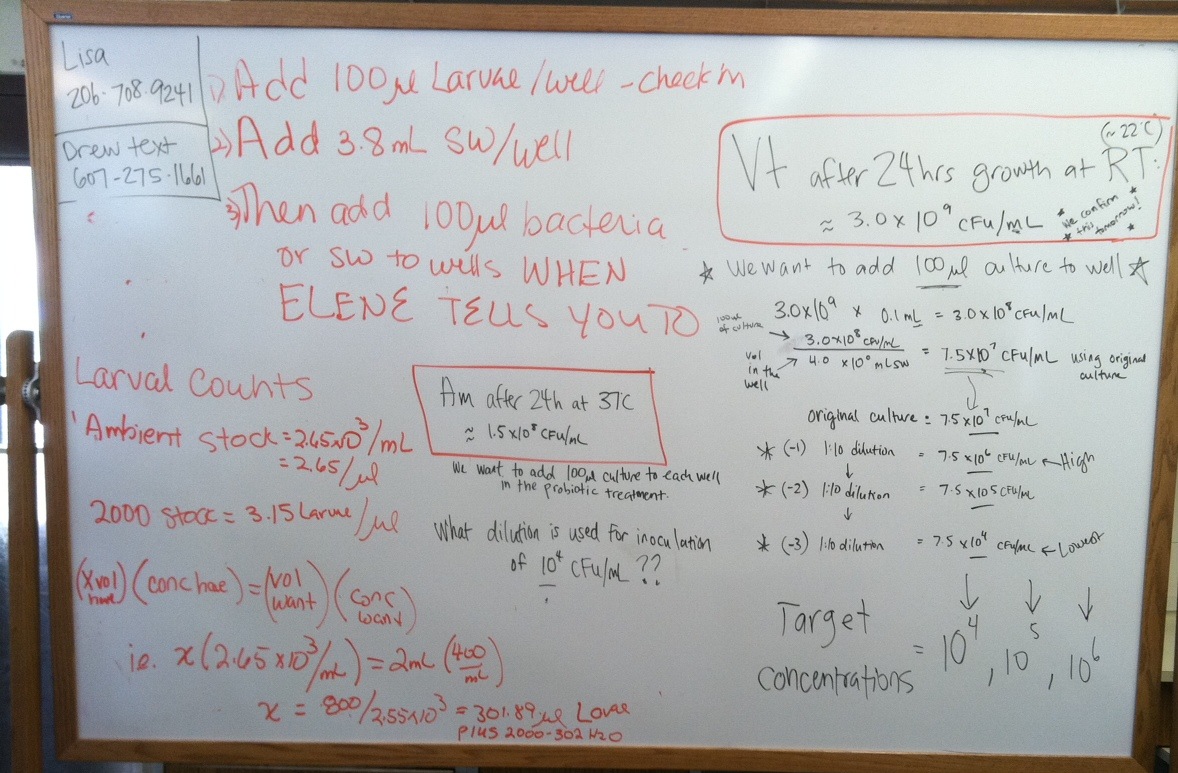
- Fill each well with 100ul of larvae at a density of ~40 larval oysters/well with 3 replicates for each Vt dilution.** Note 100ul did not equal 40 larvae, Caroline had to give us a different concentration, we ended up adding 25ul.
- Caroline made up our larvae dilution (see calculation above).
- We found it was easier to count the larvae by adding the larvae 1st and then the water.
- While we were shooting for 40 larvae/well, we actually had 35-55/well. This is ok, because we are going to calculate the relative difference in mortality.
- Add 3.8ml of sterile seawater to the wells
- Inoculate wells with 100 ul of the appropriate bacterial dilution (104, 105, or 106) to bring total well volume to 4mls. Remember not to inoculate your control wells with Vt.
Diagram of the Pacific oyster disease challenge experimental set up in tissue culture plates.
8/9/12 AM Lab
LARVAE MORALITY ESTIMATION
- On day 1 post-challenge (3-4 hours for mortality estimation/day)
- Record oyster mortality in each well. Only count dead larvae; total larvae will be tallied at the end of the trial. *On inverted scope
- It would be best to have 1 person do all the counting, but we all wanted to get experience, so we each counted 1 of the rows of wells
- Re-isolate bacteria on T1N2 and TCBS plates from one control and one 10-6 well using the streak plate method (see below). Be sure to include treatment, dilution, well # sampled, the date, and your initials on the BOTTOM of the petri plates.
- Count T1N2 dilution plates (10-5 through 10-7) you made yesterday and examine colony growth, morphology, and color for both T1N2 and TCBS plates.
- Record oyster mortality in each well. Only count dead larvae; total larvae will be tallied at the end of the trial. *On inverted scope
- On day 2 post-challenge
- Record the number of dead oysters in each well.
- Kill all larvae in each well using a small amount of diluted bleach and record total amount of larvae in each well.
- End experiment and clean up.
We also checked on our plates from 8/7 (passing the cultures): We had Vibrio on the TCBS plates and our Am and Vt grew up (some inhibition at the juncture of the Am and Vt streak.
Serial diluation Vt and Am plates from 8/8/12:
Vibrio on the TCBS plate, but none of the Vt or Am dilution cultures grew up (Elien reconsitutued bacteria in di water not seawater). Sonia and Ashton's were the only plates that grew up, so we used their bacterial counts to calculate concentration of starting culture
Sonia/Ashton counts:
| plate |
10^-7 |
10^-6 |
10^-5 |
| 1 |
2 |
5 |
33 |
| 2 |
1 |
0 |
4 |
| ave |
1 |
2.5 |
18.5 |
Count spread plates and calculate concentration of starting culture
Choose a plate with 30 to 300 colonies to count. Count the colonies and multiply by the dilution. Also remember that when you plated, you only added 0.1 mL of the bacterial suspension to the plate so you must account for that dilution (which is 1/10).
CFU/mL = # colonies * dilution (e.g. 105) * plate dilution (10)
For instance, if you had 55 colonies on the 10-5 dilution plate then your final count would equal: 55 * 105 * 10 = 5.5 x 10⁷ cfu/mL
10^-5: 18.5 * 105 * 10=1.85 x 10⁷ cfu/mL
10^-6: 2.5 * 106 * 10=2.5 x 10⁷ cfu/mL
10^-7: 1 * 107 * 10=1 x 10⁸ cfu/mL
Does it look like your serial dilutions were precise (a ten-fold reduction on each plate)? NO
INSERT PICS
PM LAB:
Analysis and bacterial identification
- Perform Gram stain on bacteria
- Select colony from plate and suspend in a drop of water on a glass slide.
- Let air dry
- Heat fix by briefly passing over a flame (if it’s too hot to touch the slide, you heated too much but don’t worry…carry on)
- On a rack, flood with crystal violet for 1 min
- Wash briefly in tap water to remove excess crystal violet
- Flood with Lugol’s or Gram’s iodine 1 min
- Wash briefly in tap water
- Immediately, de-colorize with alcohol-acetone solution until the stain runs past the lower edge of the section (this is very rapid: do not over de-colorize)
- Wash immediately in tap water
- If the section appears too blue repeat steps h and i
- Counterstain with safranin ~15 sec
- Blot dry, add immersion oil and view at 100x
Examine results:
Gram positive bacteria.........................................purple/dark blue/black
Filaments of nocardia and mycobacteria.............dark blue but may have red sheathGram negative bacteria…………………...........red- We found red rodsNuclei ..................................................................red
Serum Agglutination Test
- Add 50 uL of sterile seawater and 25 uL of your culture to one slide (control)
- To one slide (your test slide) add 25 uL of sterile seawater and 25 uL of your culture and 25uL of the thawed polyclonal antibody.
- Gently mix solutions on both slides with sterile pipet tips (gently suck up and down)
- Incubate at room temperature for 5 mins
- View at 10x or 4x on the scope to compare degree of agglutination of the cells.
Preparing more Liquid Culture-1. Consolidate all the liquid cultures (we have multiple tubes of each strain- consolidate by strain)2. Spin down3. Pour off some of the media to concentrate down & added 15 ml of media
PM Set up the laby innoculation experiment:
Methods:
- Sonia cut 8cm fragments of healthy seagrass, which she has been healing for 4 days in sw tanks
- Each fragment was photographed with a ruler and number corresponding to plates
- Fragments were quickly dipped in EtOH and sterile seawater to "sterilize" surface.
- They were put in petri dishes with 25ml of sterile seawater (autoclaved).
- @ 7pm: cut autoclaved blades with laby longitudinally and clipped to experimental blade.
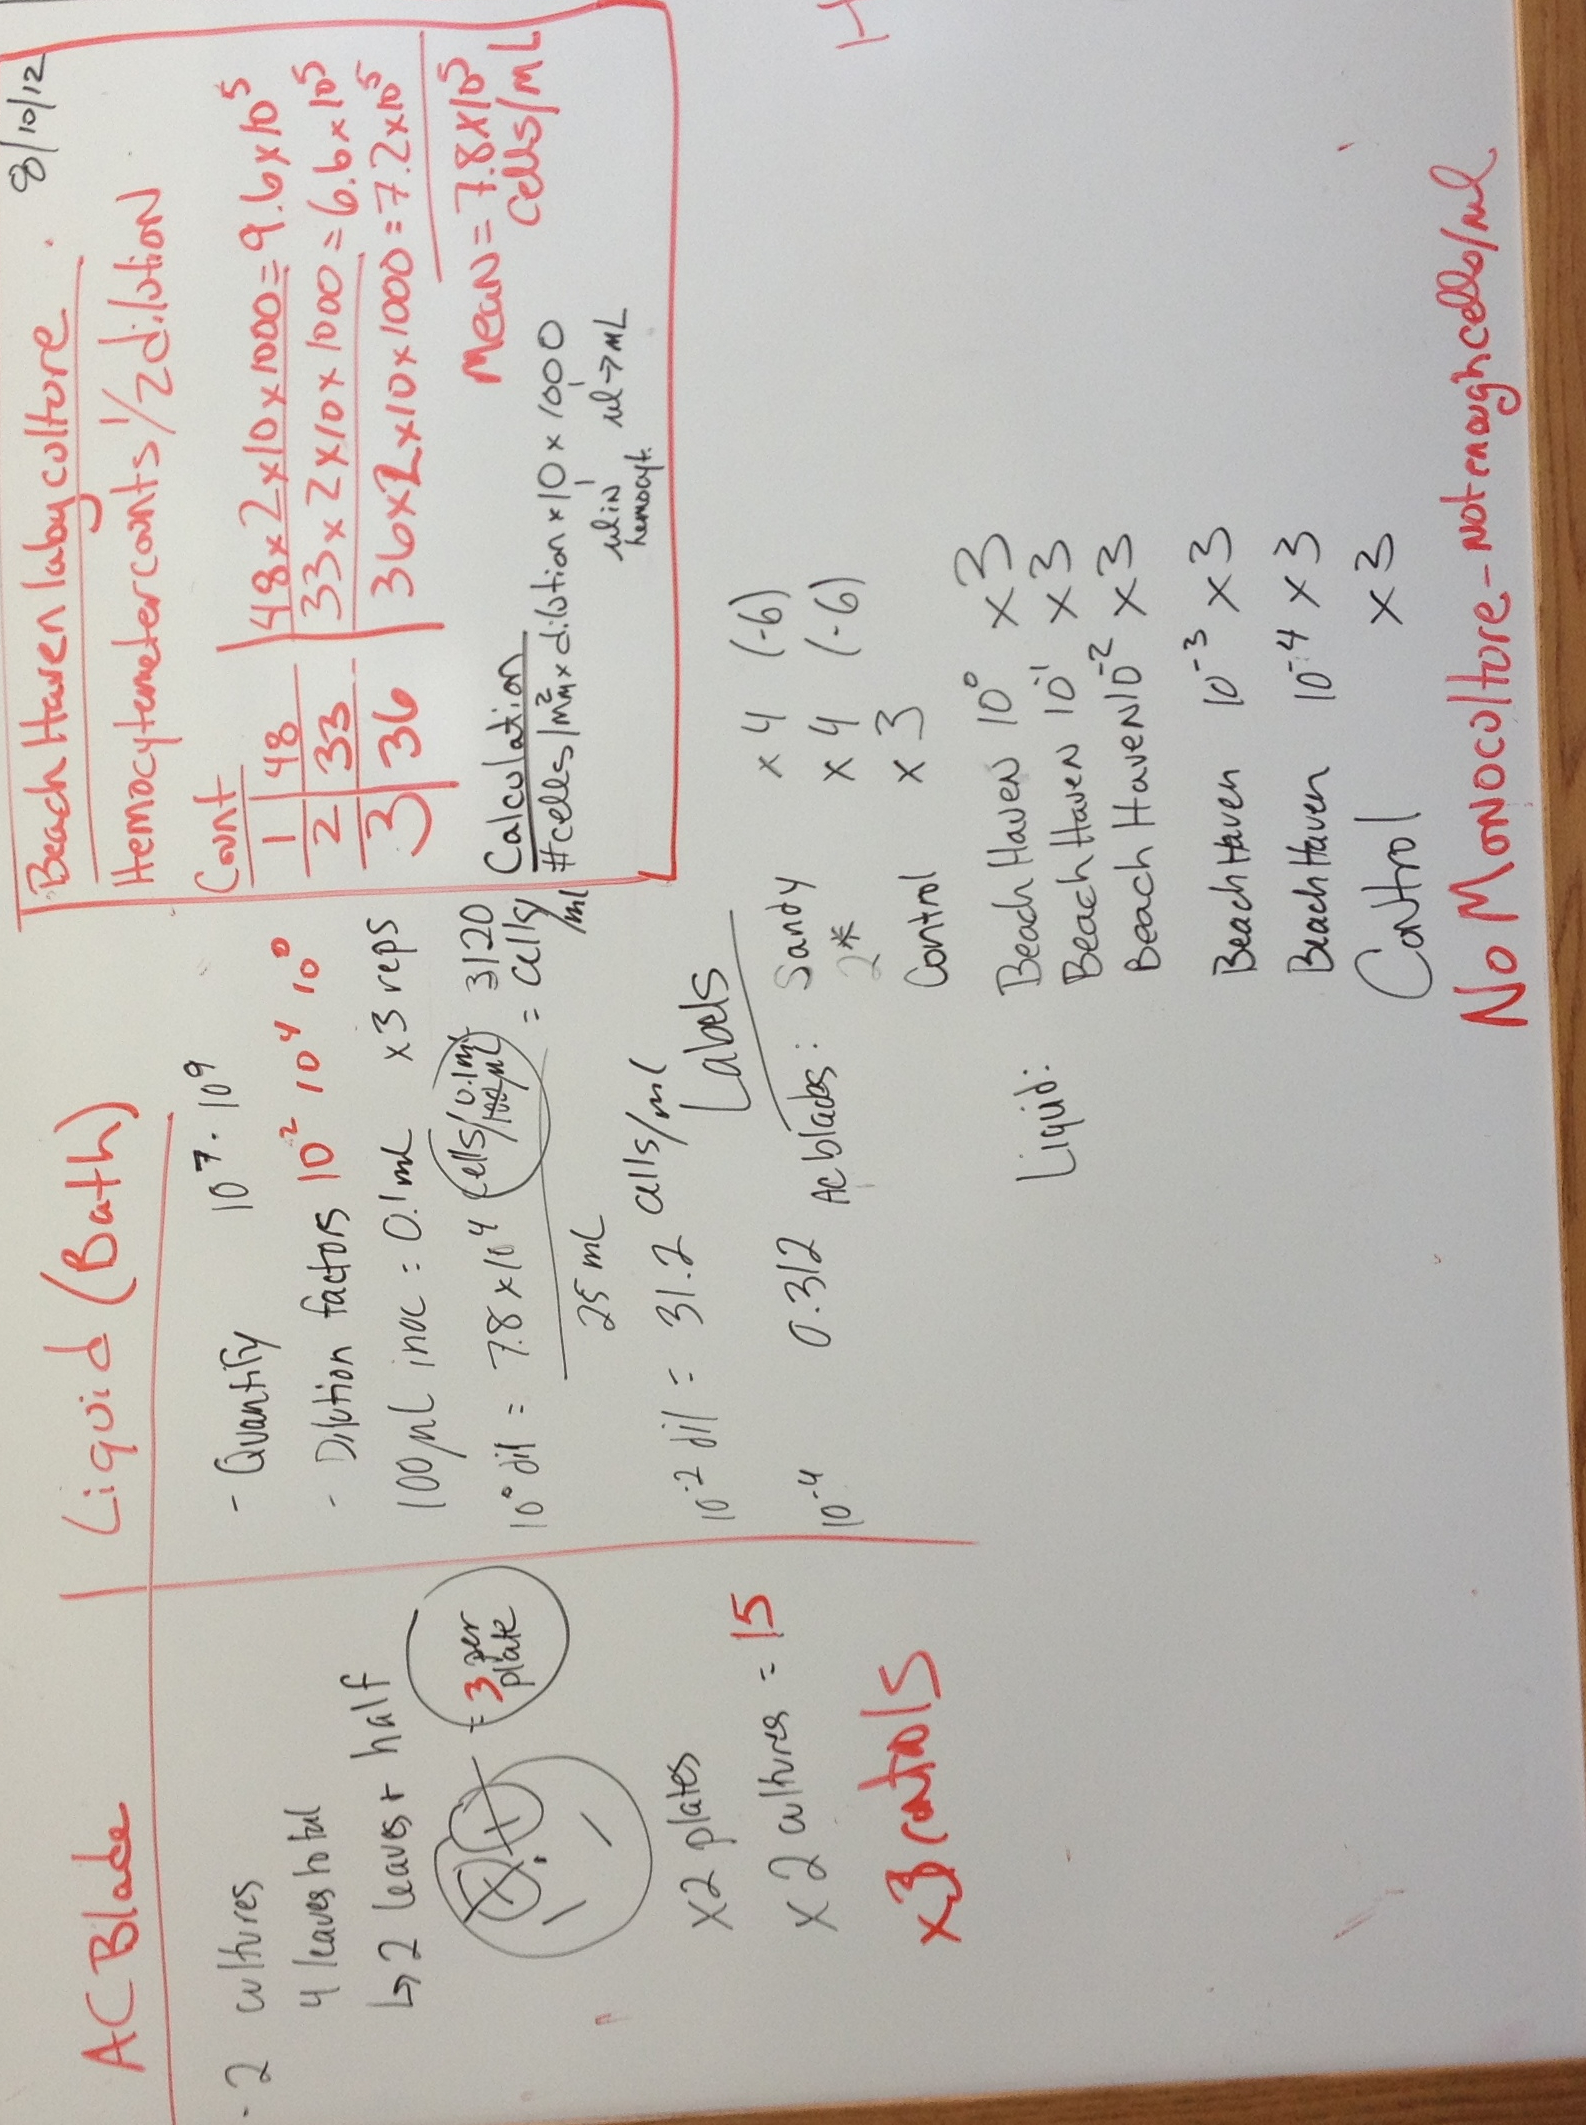
- I counted the zoospores in concentrated laby liquid cultures
- We didn't have enough zoospores for the monoculture, but the beach haven isolate was ok. (we only used BH & increased the number of dilutions for the inoculations).
Follow-up Laby Inoculation ExperimentSaturday AM- No gross signs of diseaseSunday AM- No gross signs of diseaseMonday AM- Several of the autoclaved blades showed initial stages of lesion development.Monday PM: Most of the autoclaved blades developed significant lesions extending away from autoclaved blade, but no signs of disease in the bath samples.Monday noon: Took pictures of all the autoclaved blade experimental blades with and without the autoclaved blades
We are going to analyze the lesion size in Image J and save some samples for histology to confirm presence of the laby.
WEEK 4: BIOINFORMATICS
Steven's Notes: We received the first batch of data off the Illumina Hi-Seq machine.
With regard to QPX- three libraries were sequenced
- DNA
- mRNA with culture grown at 10C
- mRNA with culture grown at 21C
You can see the raw data (or download) from the DNA library @
http://aquacul4.fish.washington.edu/~steven/armina/filtered_QPX_DNA_GTGAAA_L001_R1.fastq.gz
Each library has 1 million reads @ 36bp/read
Steven's Notes:
RNA-Seq
RNA-seq analysis (comparison of gene expression in the two libraries)
First, the short reads from both the 10C and 21C library are imported into CLC.
This is what it looks like, a lot (~40million reads / mRNA Library) short (36 bp) reads.
The next step will be to assemble all of the reads together from the 10C and 21C library to create a "backbone" that will be used for comparison.
There are other software available for de novo assembly of short read transrcriptome sequencing data.
For more information and links to those softwares see
http://seqanswers.com/wiki/How-to/de_novo_transcript_assembly
CLC was used to assemble all of the transcriptomic short reads.
Attached is video showing you what it looks like.
also @
http://aquacul4.fish.washington.edu/~steven/armina/QPX_transcriptome_assembly.mov
A fasta file respresenting all contigs can be seen @
http://aquacul4.fish.washington.edu/~steven/armina/QPX_transcriptome_v1.fa
Once these contigs have been generated, then we go back and map reads from each library separately to the contigs to compare transcript expression in between the two mRNA libaries (QPX grown at 10C and 21C).
(in this case, 11,280 contigs were produced)
Attached is the video showing how reads from one library are mapped to the contigs.
also @
http://aquacul4.fish.washington.edu/~steven/armina/QPX_RNAseq_CLC.mov
The same thing is done for the other library.
Here is a simplified table showing the difference in number of reads from each library that maps back to the contigs.
This would be considered a core file that will allow us to look at gene expression differences between the two temperature treatments.
8/14/11Download Sonia's blast filedownload then upload into galaexy (Get Data-choose the file)Need to separate the id numbersConvert from deliminated to tab, click pipesImport the "SPID and Description.txt" file from the wiki into gallexy
now we need to rename the genes, to do this we will join the blast results and "SPID" text file, which has all the names of the genes. We are joining by the "mismatches" - aka swisspro ID #
Join the tablesJoin, Subtract, GroupJoin 2 Dataset
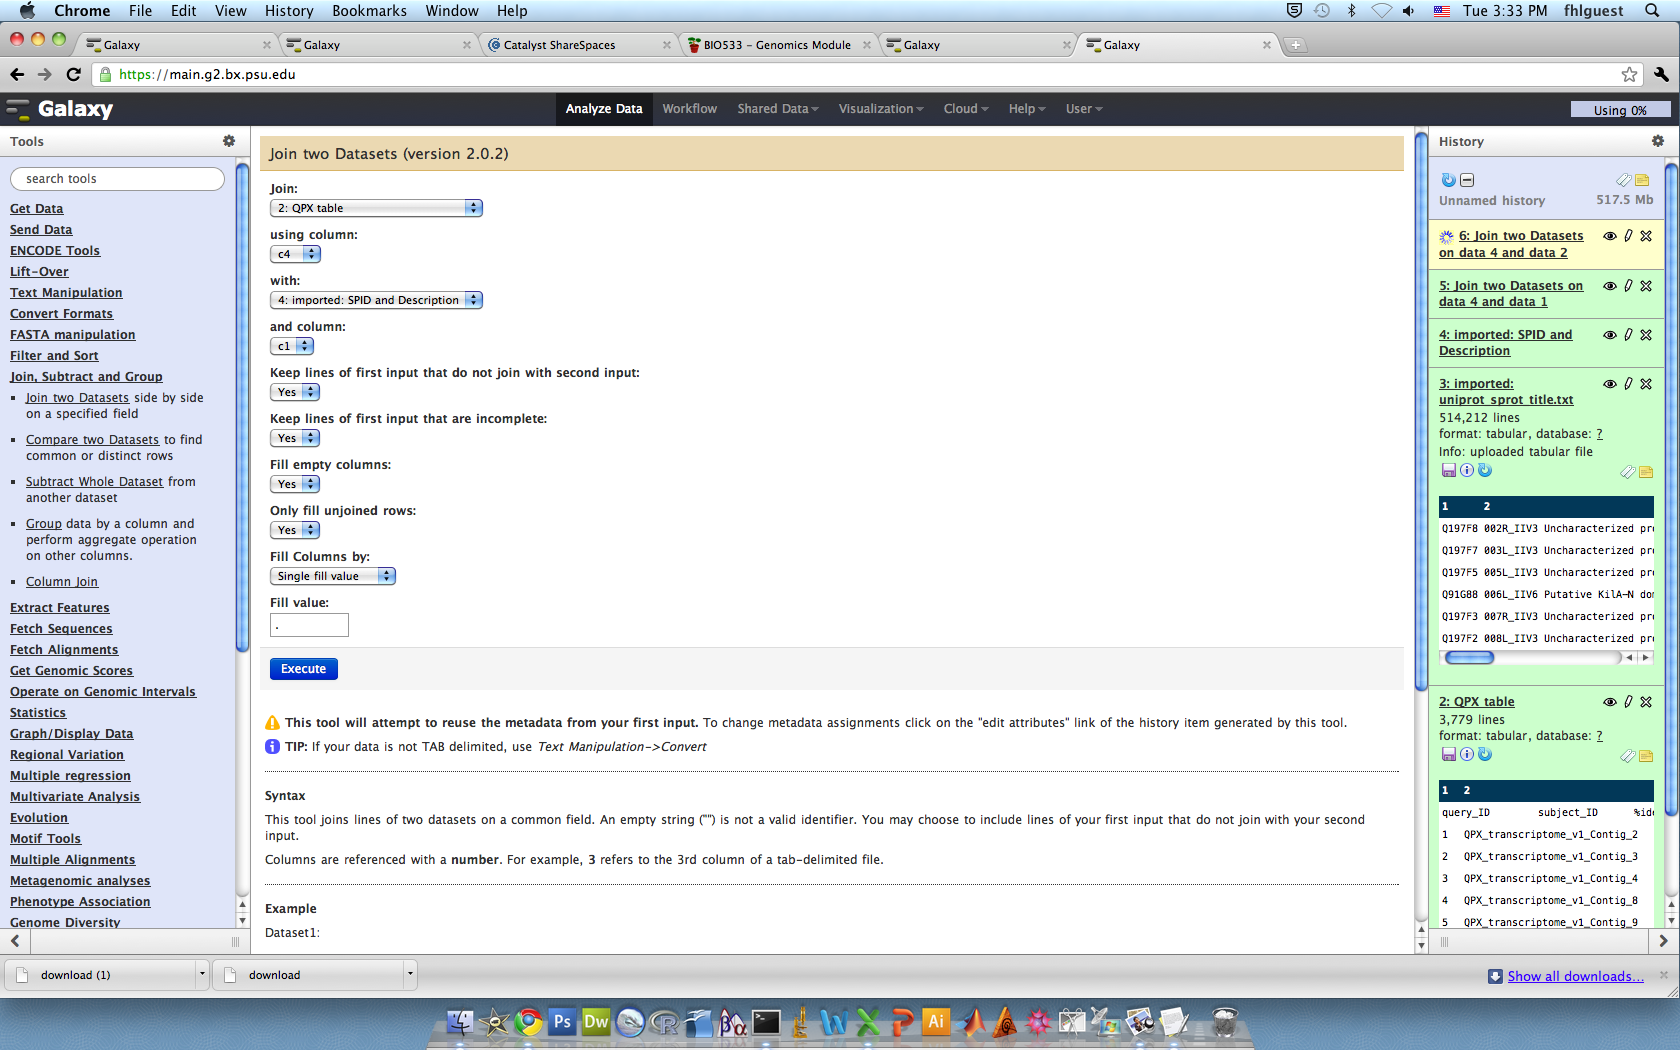
Now we have the annotated transciptome.Next step: get gene function- gene ontologyJoin associations with swiss pro & your annotated table.
Join the annotated table with go terms with the go slim.join by collumn 24 and 1
Export the joined table, save as txt, then convert to excel file
Delete all columns except:
Video for joining tables in Galaxy
http://www.youtube.com/watch?v=a8yBlGTxtiM&feature=player_embedded
8/14/12 8pm- Setting up Herbivores for laby experiment #2We bleached, soaked and rinsed 2 tanks from the OA lab to starve the lacuna in.Only took medium size range snails (Gregor weighed them out)Put snails into 1 container- Sammi wasn't around so we couldn't bedadine the snails to sterilize
8/15/12 AM Class and LabGOAL: Determine which genes are differentially expressed between the 10C and 21C treatments.In Galaxy-
only expressed genes from QPX 10 and 21C (+/- 2 fold change)
Create 2 text filesGo to DAVID Bioinformatic Resources (david.abcc.ncifcrf.gov)Start analysisGOAL: Comparing the entire transcriptome to a subset (DEG) and determine which genes are over and under represented in the transcriptome.DEG: ~1500 genesEntire Transcriptome: ~4000 genes
Past the DEG Swiss pro ids into the listchoose gene list & Unipro Accession #Submit to Conversion tool- Convert
Look at Functional Annotation ChartGOTERM_BP_FAT
Upregulating translation- using energy to maintain homestasis
Video for using DAVID to find enriched gene sets
http://www.youtube.com/watch?v=Ogb5H11wnNc&feature=player_embedded
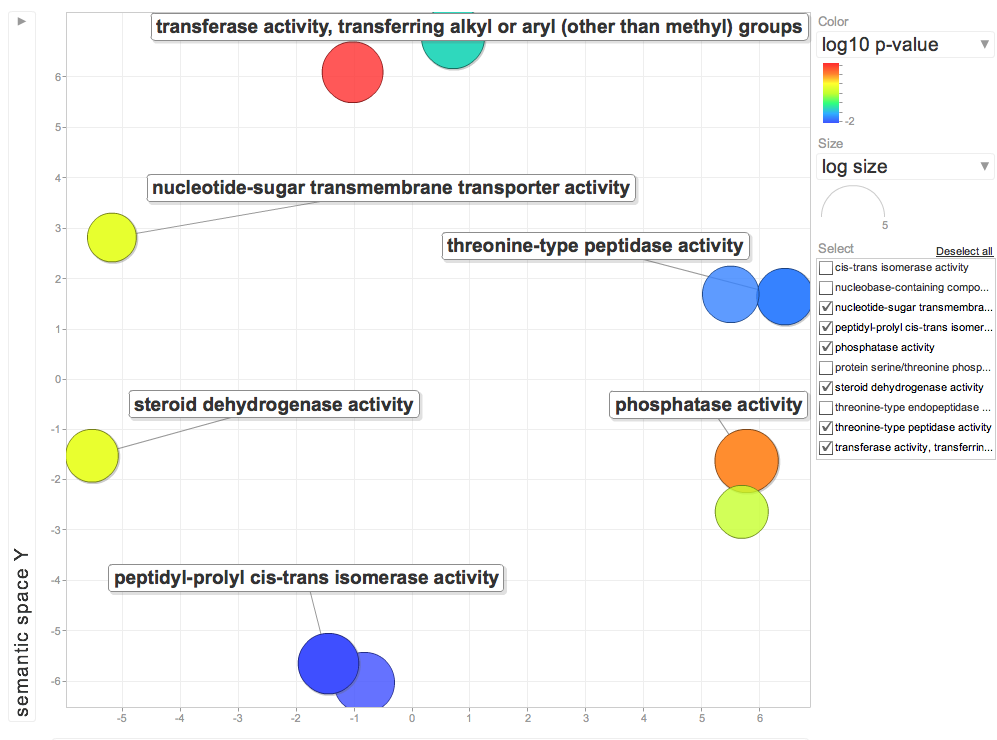
Need a table with biological function for FATDownload the data as txt fileWe want the GO # and p-valueThe GO term has the go term and gene function- we need to divide the 2- do this in excelHighlight the p-values that are >0.05REVIGO (http://revigo.irb.hr/)Reduce Visualize Gene OntologyCopy in the 2 columns
ENRICHED GENES (Differentially expressed genes compared to entire transcriptome) See video
http://www.youtube.com/watch?v=3ZnhGLGVjkA&feature=player_embedded
Enriched Biological Processes for DEG genes over represented in 10C
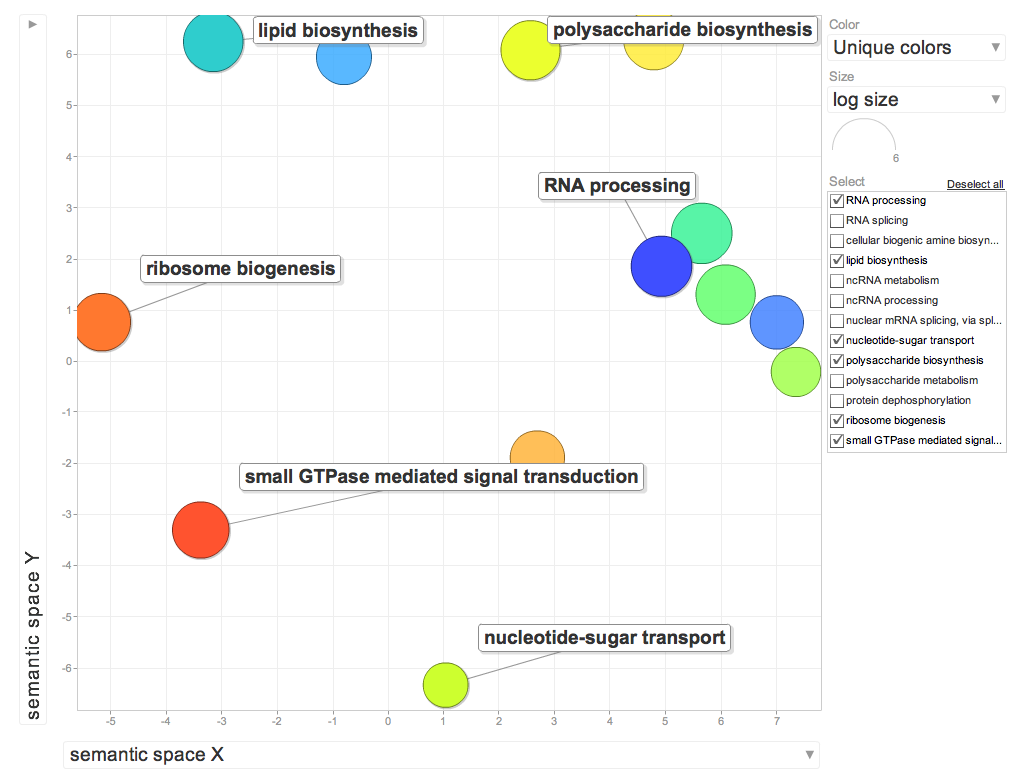
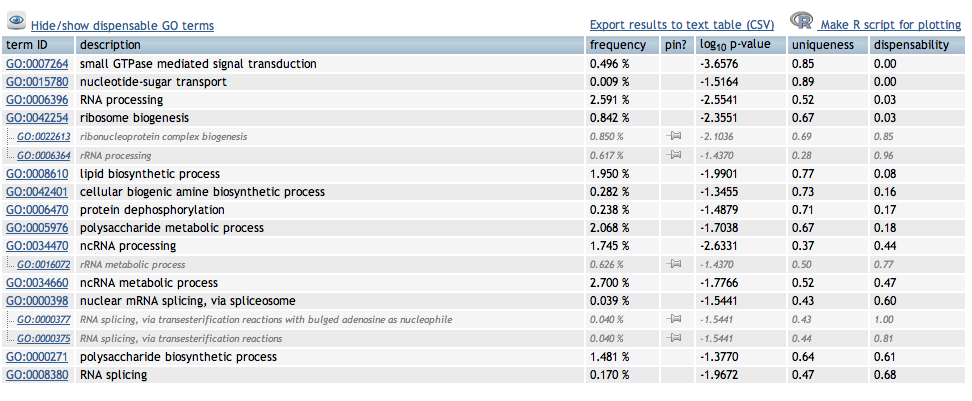
Enriched Cellular Components for DEG genes overrepresented in 10C
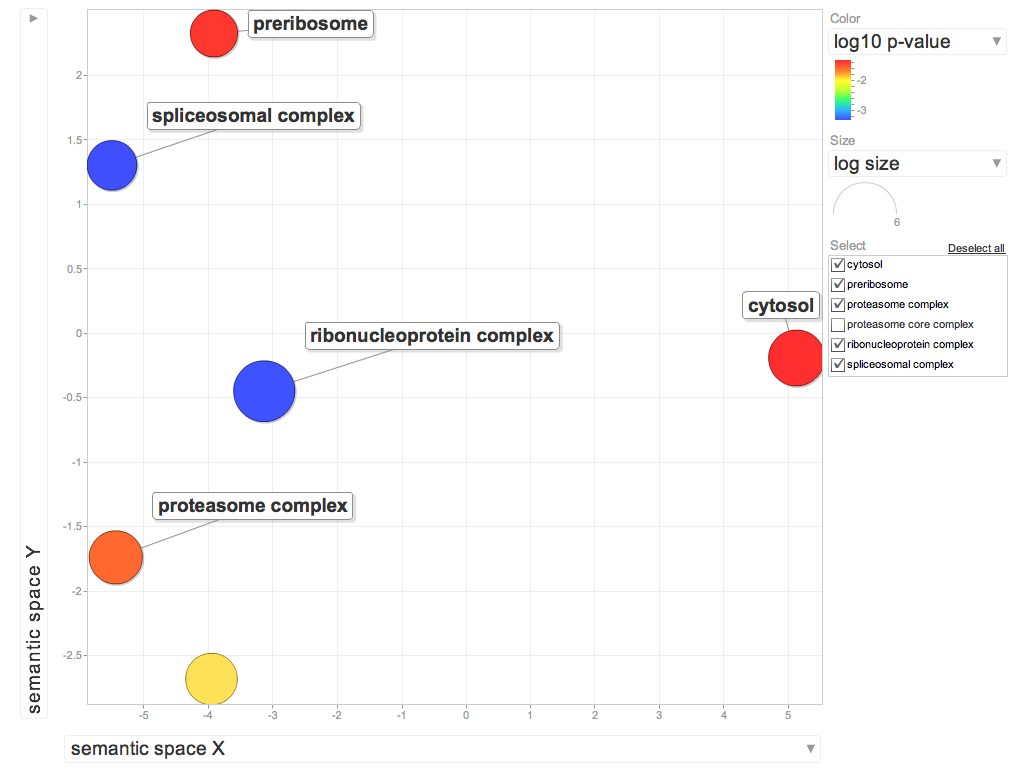
Interesting BP's
Proteasome complex: A large multisubunit complex which catalyzes protein degradation. This complex consists of the barrel shaped proteasome core complex and one or two associated proteins or complexes that act in regulating entry into or exit from the core.
Enriched Molecular Function for DEG genes higher in 10C
Review of Workflow:
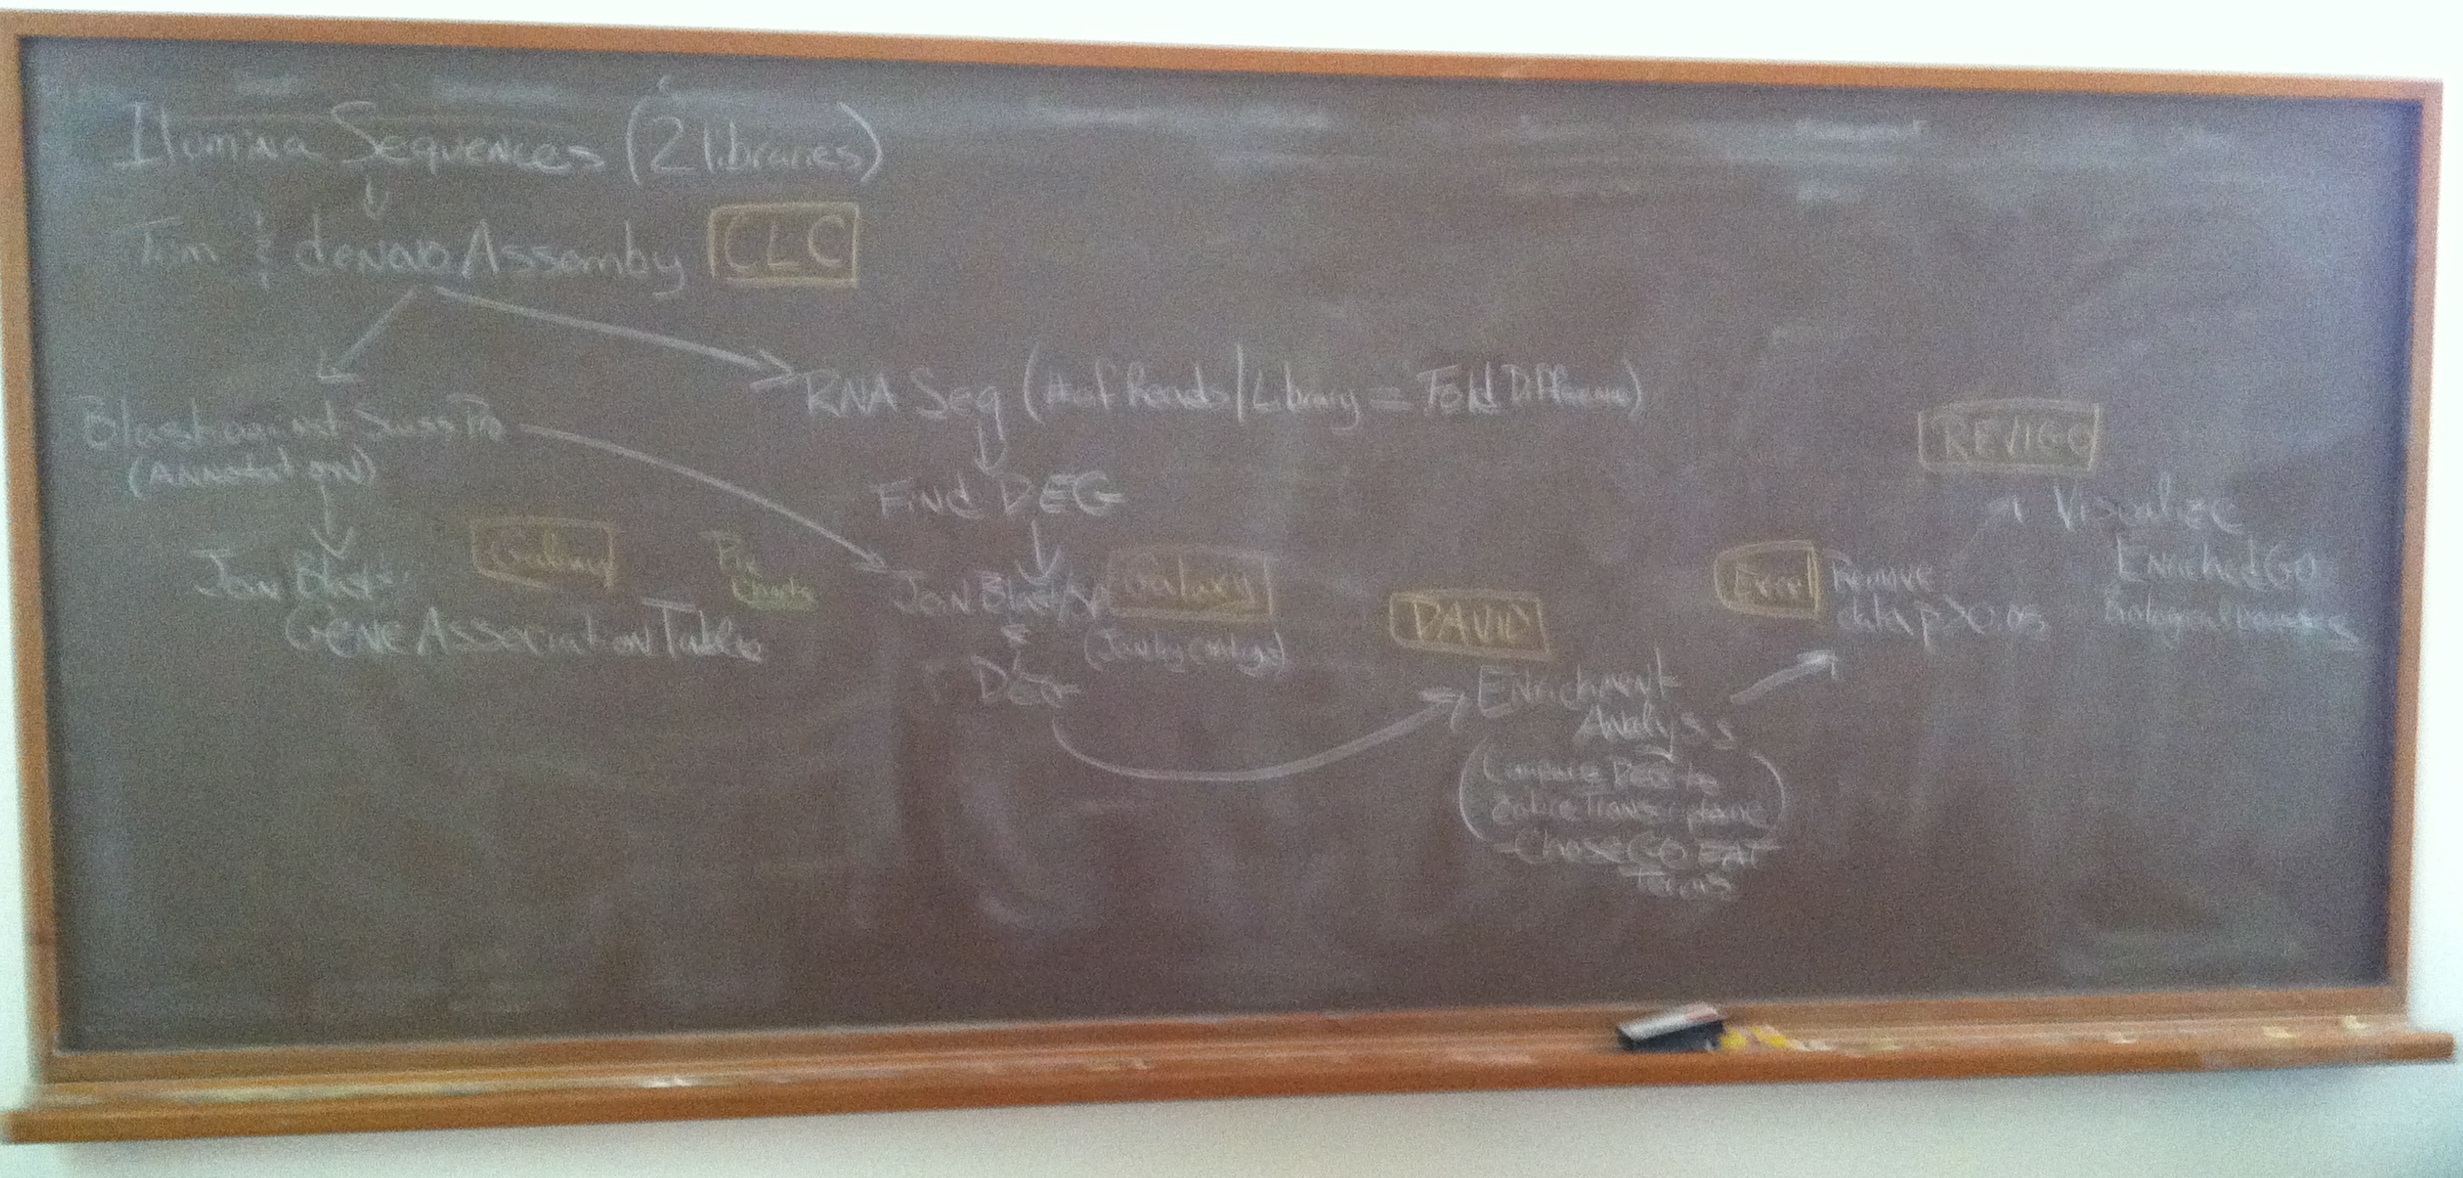
Electronic version of workflow
Very beginning
- trimmed reads
- De novo assembly
- De novo assembly blast against Swiss-Prot (terminal) (provides just SP ID)
- De novo assembly used to map reads from each library (RNA-Seq)
- Used Galaxy to get much more information (gene description and GO information)
- Differentially expressed genes were identified (2-fold)
- Used Galaxy to get SP ID of just the Differentially expressed genes
- Enrichment Analysis using DAVID- using Background SP ID and DEG (Gene list) SP ID
- Downloaded files (GO FAT BP) from DAVID
- Tweaked GO FAT BP in Excel
- REVIGO used to visualize Enriched GO BP Processes
Thursday Game Plantotal RNA libraries ( interested in bacteria, viral genome is unknown -DNA or RNA)blast against the nucleotide databaseHealthy Abaolone DG, DG with RLO's, DG with RLO and phageAbalone-metagenomic analysisthree libraries-libraries total RNA sequencesBlasting (NCBI blast against nt)
Annotated & specific to virus or bacteriaVirus ref seqbacteria ref seq
8/16-17/12 Metagenomic Analyses of bacterial & viral communities in healthy, withering syndrome only and withering syndrome with phage from Black Abalone.
Blastn against GenBank- stand alone (we already downloaded the databases for viruses only)Reference assemblies- map raw reeds and map raw reads back to reference in GALAXYMetagenomic analayses in Galaxy- Steven blasted to BLASTnt back on his server- available on tumblr
wants GI # and separate -pipes Fetch genomic representation on file
IN TERMINAL:
Command line
ocean1:~ fhlguest$ cd /Applications/blast
ocean1:blast fhlguest$ cd bin
ocean1:bin fhlguest$ ls
blast_formatter deltablast rpstblastn
blastdb_aliastool dustmasker segmasker
blastdbcheck legacy_blast.pl tblastn
blastdbcmd makeblastdb tblastx
blastn makembindex update_blastdb.pl
blastp makeprofiledb windowmasker
blastx psiblast
convert2blastmask rpsblast
####We downloaded the fasta files, but you need to make them databases before you can blast against them- @ the nucleotide level
#Convert WSP assembly into database
ocean1:bin fhlguest$ ./makeblastdb -in /Users/Shared/EIMD_blast/db/BlackAb_WSP_assembly.fa -out /Users/Shared/EIMD_blast/db/BlackAb_WSP_assembly -dbtype nucl
#Convert Bacterial RefSeq into database
ocean1:bin fhlguest$ ./makeblastdb –in /Users/Shared/EIMD_blast/db/BACTERIA_RefSeq.fasta -out /Users/Shared/EIMD_blast/db/ BACTERIA_RefSeq -dbtype nucl
#Convert WSP-NWS assembly into database
ocean1:bin fhlguest$ ./makeblastdb -in /Users/Shared/EIMD_blast/db/BlackAb_WSP-NWS.fa -out /Users/Shared/EIMD_blast/db/BlackAb_WSP-NWS -dbtype nucl
######Blastn searches- identify where the file is that you would like to blast against the database, identify which database you would like to use, name the output file, id the output format, id the number of target sequences and e – value cut off.
##blast NWS against WSP
Code is ./blastn -query /Users/Shared/EIMD_blast/query/BlackAb_NWS_assembly.fa -db /Users/Shared/EIMD_blast/db/BlackAb_WSP_assembly -outfmt 6 -out /Users/Shared/EIMD_blast/out/BlackAbCompareNWS_WSPblastn -max_target_seqs 1 -evalue 1E-20
#Blast WSO to WSP-NWS
./blastn -query /Users/Shared/EIMD_blast/query/BlackAb_WSO_assembly1.fa -db /Users/Shared/EIMD_blast/db/BlackAb_WSP-NWS -outfmt 6 -out /Users/Shared/EIMD_blast/out/BlackAb_comp_WSO_new_blastn -max_target_seqs 1 -evalue 1E-20
##I Blasted the WSO-NWS to Bacterial database
#Blast WSO to WSP
Code is ./blastn -query /Users/Shared/EIMD_blast/query/BlackAb_WSO_assembly1.fa -db /Users/Shared/EIMD_blast/db/BlackAb_WSP_assembly -outfmt 6 -out /Users/Shared/EIMD_blast/out/BlackAbCompareWSO_WSPblastn -max_target_seqs 1 -evalue 1E-20
#Blast WSO/WSP to Viral database
Code is ./blastn -query /Users/Shared/EIMD_blast/query/WSO_WSPjoin.fa -db /Users/Shared/EIMD_blast/db/VIRUS_RefSeq -outfmt 6 -out /Users/Shared/EIMD_blast/out/WSO_WSP_comp_VIRUStblastn -max_target_seqs 1 -evalue 1E-20
Work Flow for Abalone Project (there are a lot of ways to analyze these libraries- this was my approach)
Download sequences that Steven provided
In TERMINAL
Blast the NWS to WSP (BLASTn)
Join blast results to WSP fasta file (convert to tabular first- in Galaxy) join by the WSP contig
In EXCEL
Delete all common contigs (just bacteria)
Convert unique contigs back to fasta file
Blast new fasta file against the Bacterial database= Bacterial hits
Create a figure of bacterial diversity & % of hits to known bacteria at family level (see below)
Blast WSO to WSP
Join blast results to WSP
Convert to tabular and exclude everything but contig, coverage and sequence
convert to fasta file
Blast against the viral database
I got hit to 1 contig (contig2)
Blasted the sequence in NCBI and came up as a granulovirus (see below)
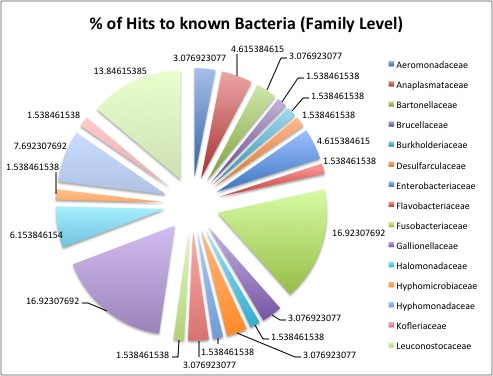
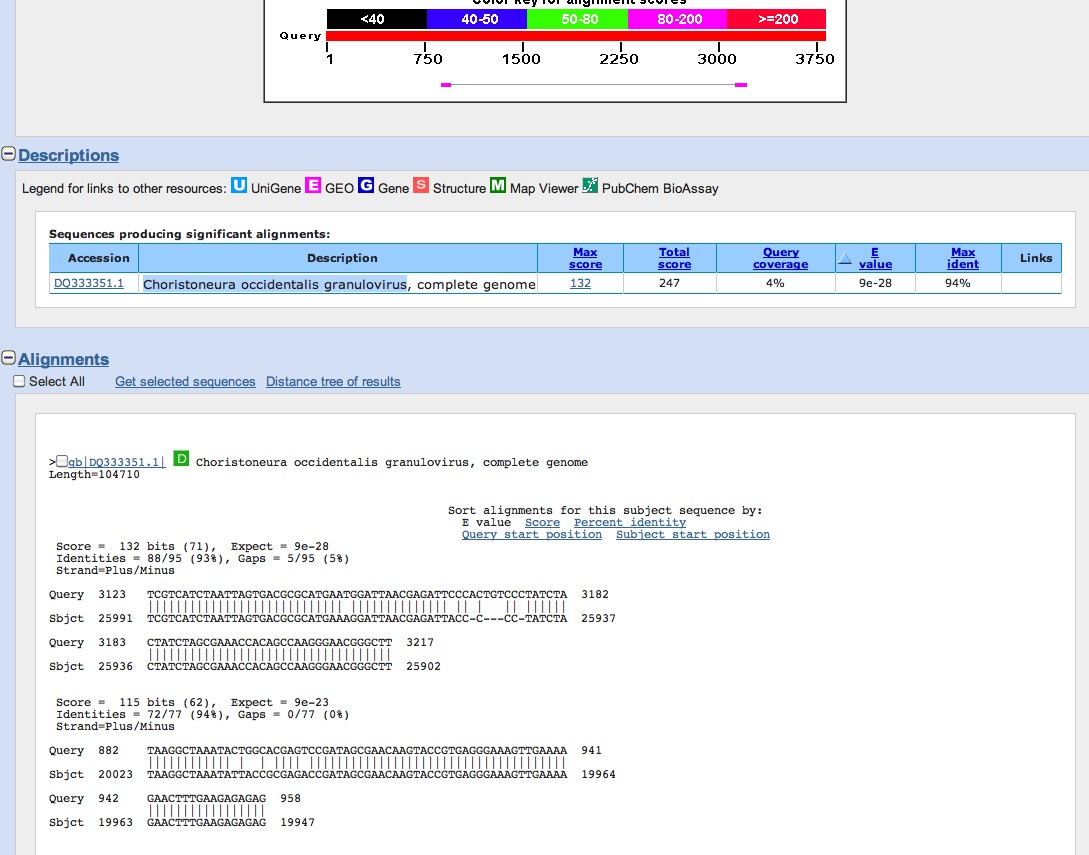
We summarized our findings and figures. Here are a few summary points from our analyses:
- AMY- Found hit to a Abalone shriveling syndrome affects farmed Haliotis diversicolor in China, and the virus we matched with has been shown to induce the disease. “The AbSV genome is a 34.952-kilobase circular double-stranded DNA, containing putative genes with similarity to bacteriophages, eukaryotic viruses, bacteria and endosymbionts…Genomic characterization of AbSV indicates that it may represent a transitional form of microbial evolution from viruses to bacteria."
- Jenna- looked at diversity across all libraries and compared number of classes and unique classes in each library. Found highest # of classes in healthy libraries (healthy= higher microbial diversity & highest # of unique classes).
- Sonia, Anna and me- all found the granulovirus
Saturday 8/18/12 Mapping QPX transcriptome to genome:
Steven provided both the QPX de novo genome and transcriptome.Goal: Map the transcriptome to genome to understand how protein-encoding genes are situated along the genome.Use RNA Seq to map the reads back to the transcriptome and look at differential expression.
Why do this?
- look at the relationship between actively transcribed genes and location on genome- in other words, does the location on the genome determine transcriptional activity?
- Does transcription vary as a function of gene density- genes working together?
SNP file- look at allele variation & what type of mutation- transversion
map transcriptome to genome
looked at number of SNPs/DEG in the QPX transcriptome (are the DEGs that have more snps less conserved)- then look at whether there is a relationship between this and the GO process
